
PART 1
Understanding and Collecting the Data
1 - Introduction
Júlia is a film enthusiast who decides to take a chance and invest in a startup, MoviesNow. She soon realizes the company is poorly organized and, even while preparing its first project, does not know the market patterns of this entertainment sector.
To help MoviesNow improve its strategy and direction, Júlia decides to use her Data Analysis skills, aiming not only to collect data but also to turn it into valuable, actionable information. To do that, she goes looking for a dataset.
2 - Dataset
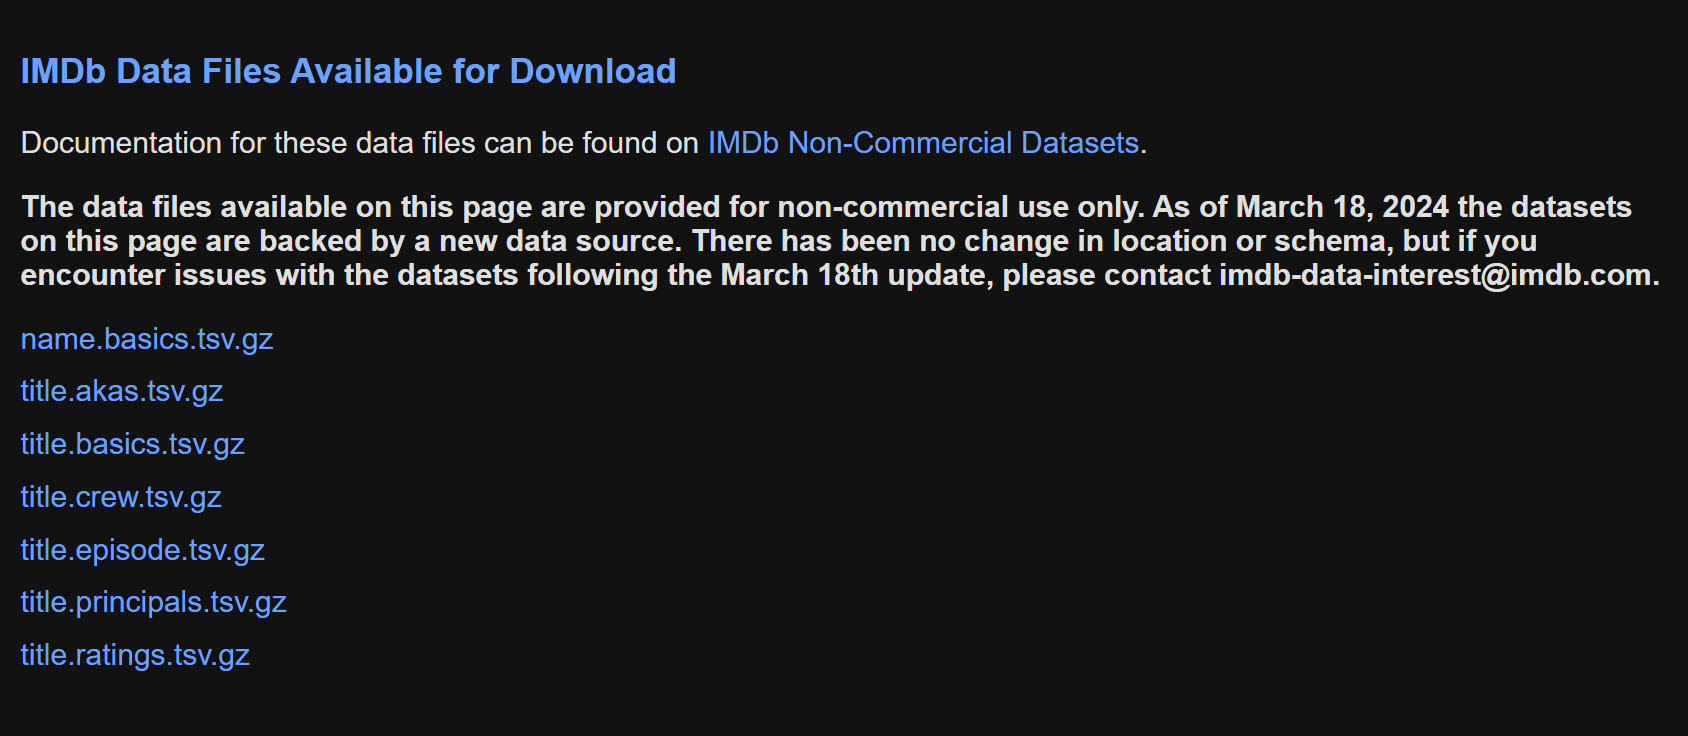
Júlia looks for a robust, informative dataset for data analysis, which leads her to IMDb, an extensive and up-to-date data source that includes details on artists' births, their film work, movie ratings, production years and other data.
3 - Data Dictionary
Table 1: title.akas.tsv.gz
- titleId (string): Unique identifier of the title.
- ordering (integer): Unique number to identify rows for a given titleId.
- title (string): Localized title.
- region (string): Region for this version of the title.
- language (string): Language of the title.
- types (array): Enumerated set of attributes for this alternative title.
- attributes (array): Additional terms to describe this alternative title.
- isOriginalTitle (boolean): Indicates whether it is the original title.
Table 2: title.basics.tsv.gz
- tconst (string): Unique identifier of the title.
- titleType (string): Type/format of the title (movie, TV series, etc.).
- primaryTitle (string): The most popular title, or the one used by the filmmakers.
- originalTitle (string): Original title, in the original language.
- isAdult (boolean): Indicates whether it is an adult title.
- startYear (YYYY): Release year (for movies) or start year of the series (for TV series).
- endYear (YYYY): End year of the TV series.
- runtimeMinutes: Primary runtime of the title, in minutes.
- genres (array): Up to three genres associated with the title.
Table 3: title.principals.tsv.gz
- tconst (string): Unique identifier of the title.
- ordering (integer): Unique number to identify rows for a given titleId.
- nconst (string): Unique identifier of the person.
- category (string): The person's job category.
- job (string): Specific job title (if applicable).
- characters (string): Name of the character played (if applicable).
Table 4: title.ratings.tsv.gz
- tconst (string): Unique identifier of the title.
- averageRating: Weighted average of user ratings.
- numVotes: Number of votes the title has received.
Table 5: name.basics.tsv.gz
- nconst (string): Unique identifier of the person.
- primaryName (string): Name by which the person is most often credited.
- birthYear (YYYY): Year of birth.
- deathYear (YYYY): Year of death (if applicable).
- primaryProfession (array): The person's top three professions.
- knownForTitles (array): Titles the person is known for.
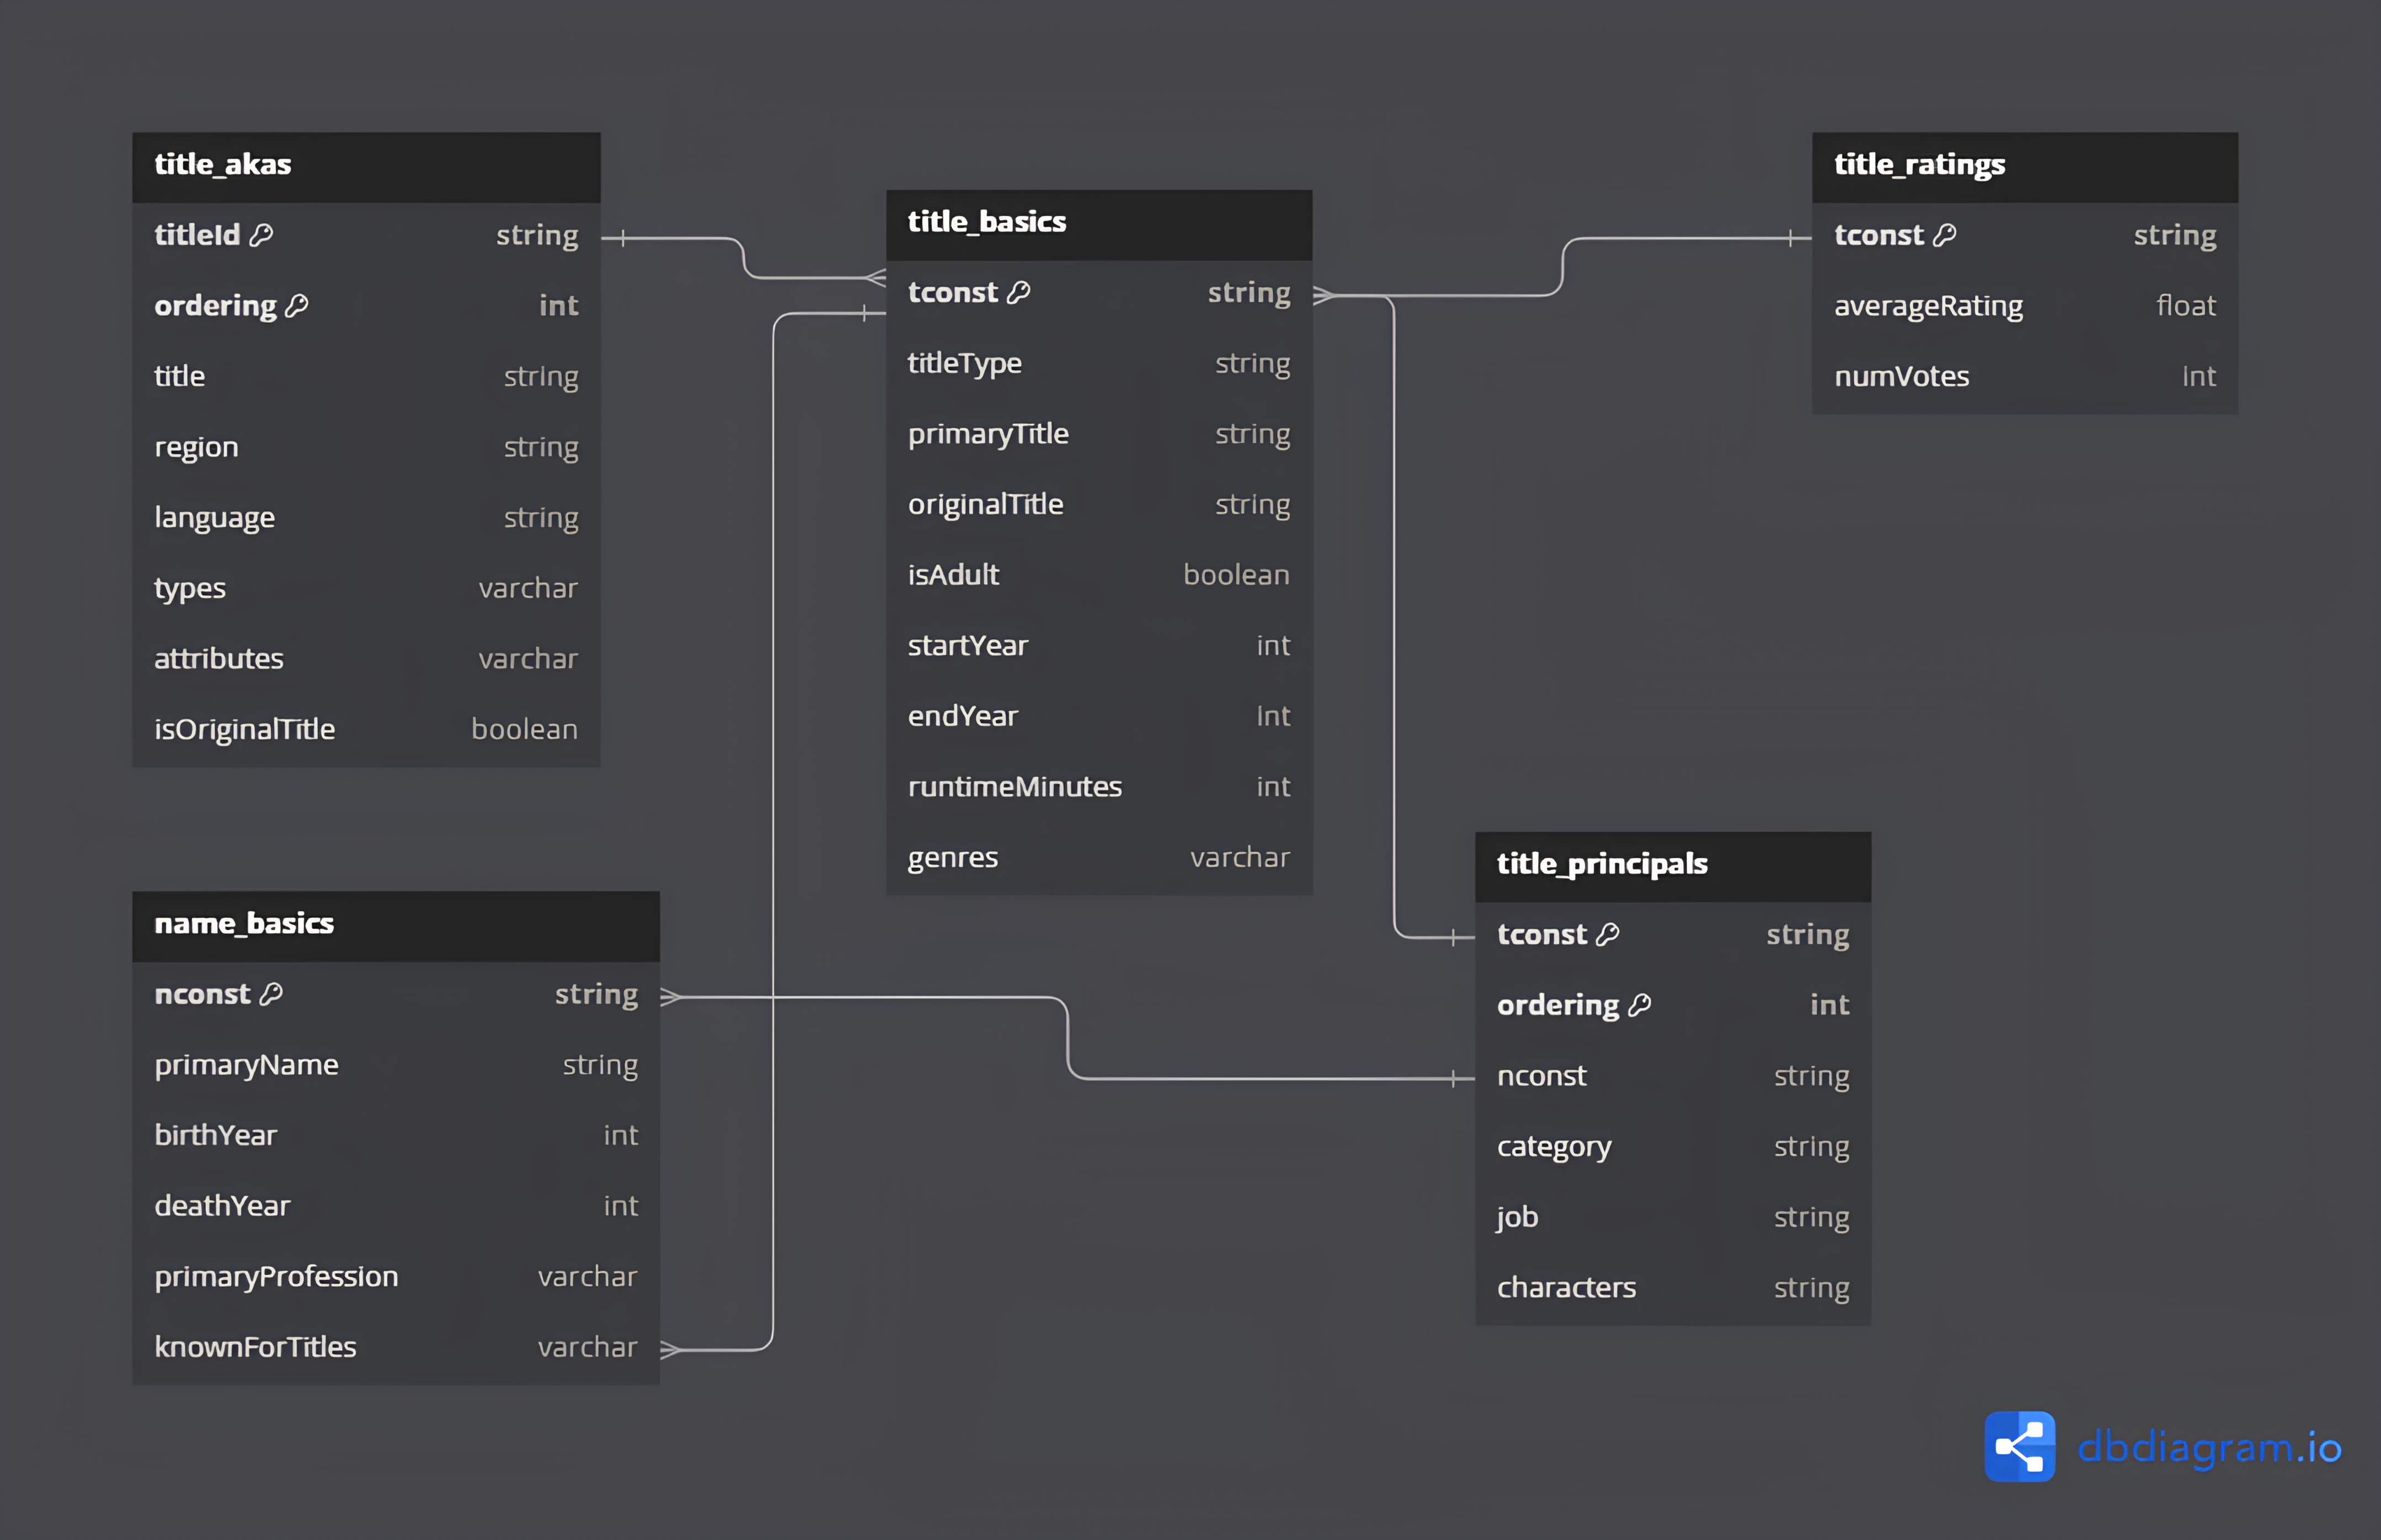
4 - Entity Relationship Diagram
With this, we can build an Entity Relationship Diagram:
5 - Transforming the Data
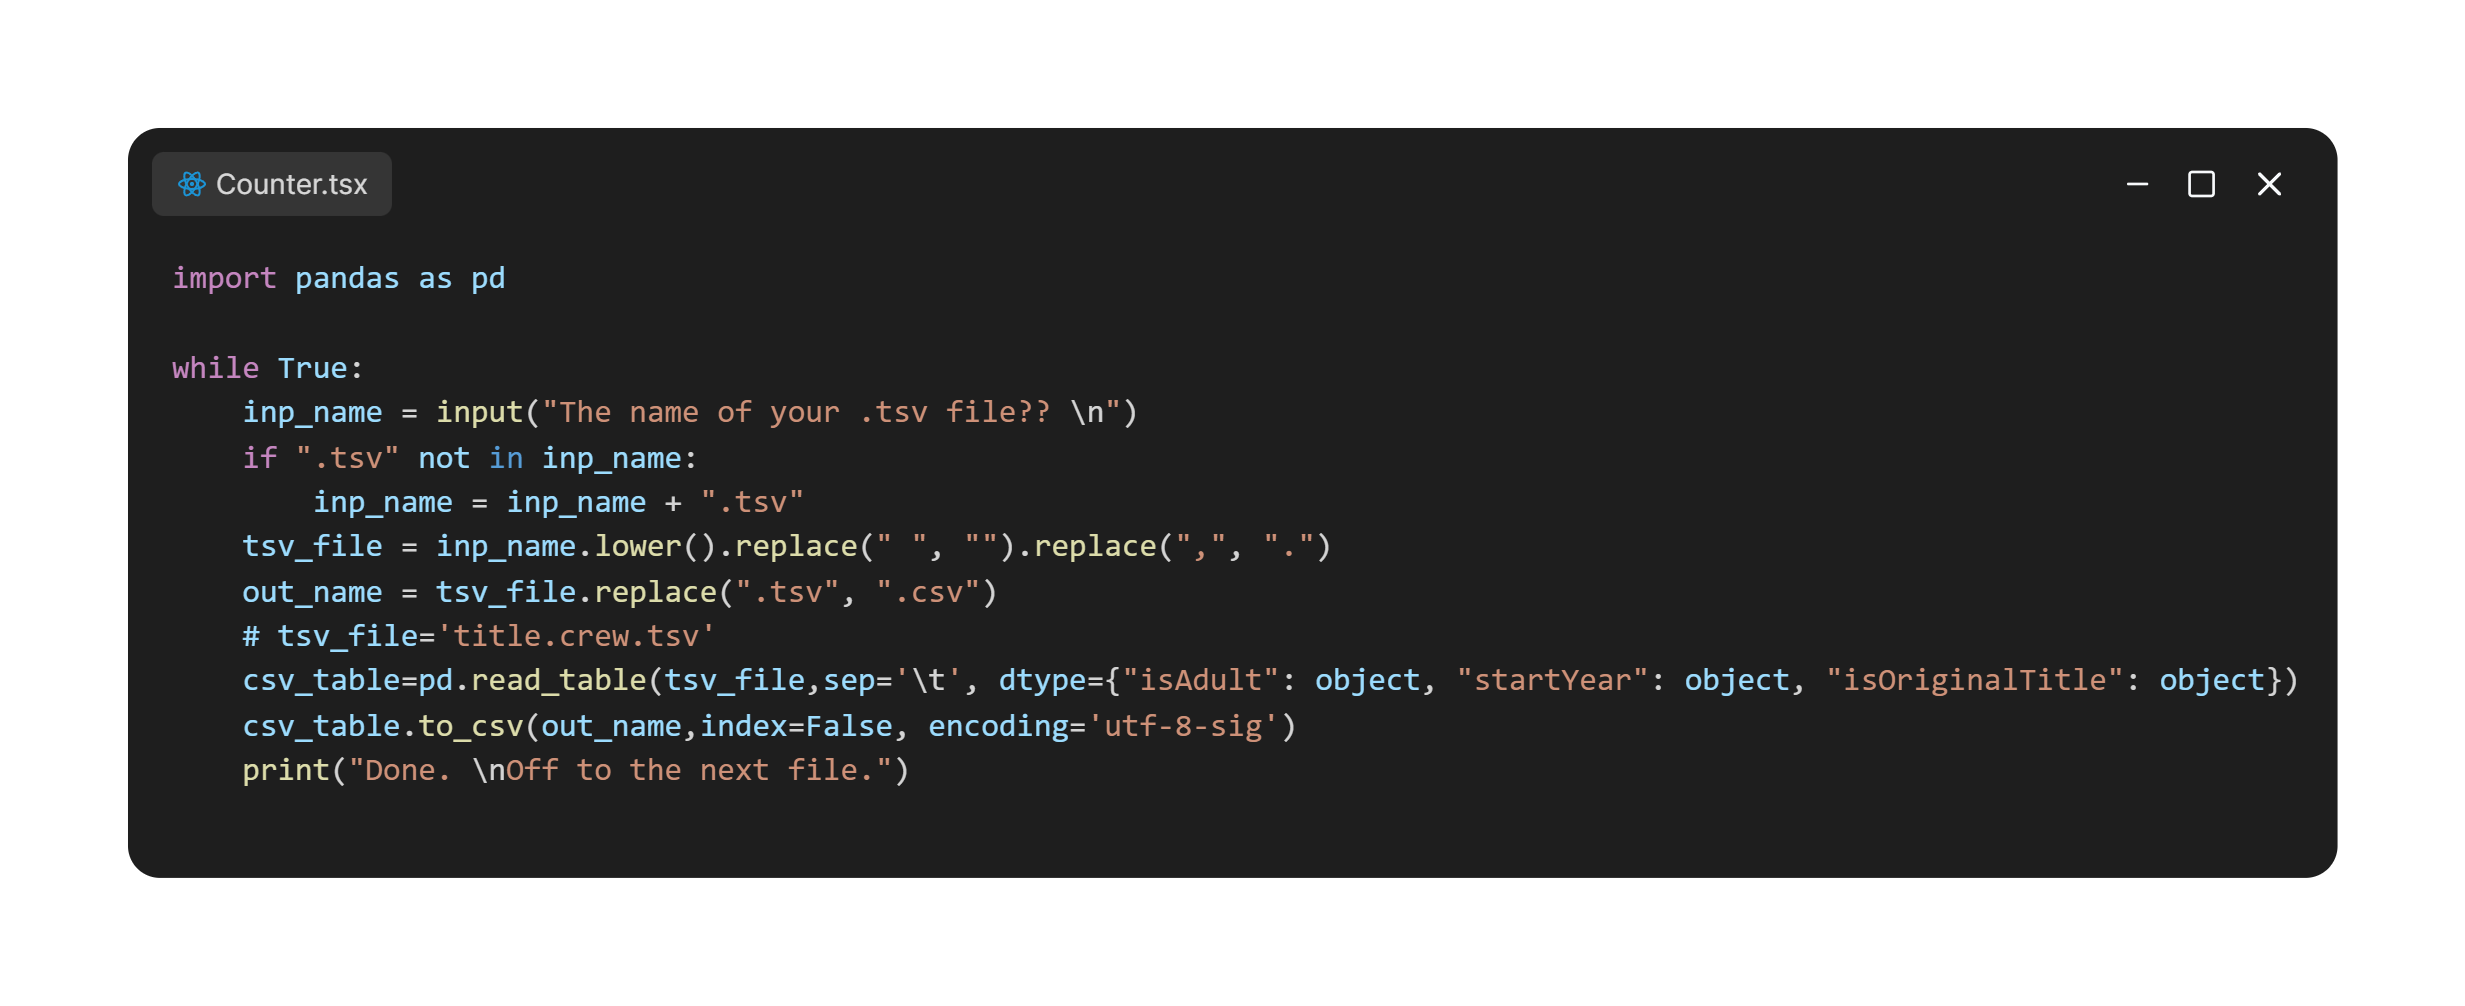
The first challenge of her project was converting IMDb's ".tsv" files into the ".csv" format supported by MySQL Workbench 8.0. Because of the size of the files, online converters could not handle the transformation. To get around this, Júlia used a Python script to do the conversion.
The Python script identified the specific patterns of the ".tsv" format and turned them into ".csv". This meant replacing tabs with commas and applying the other formatting needed for MySQL Workbench to read the data correctly. This method made it possible to convert very large files efficiently, preparing them for import and later analysis in MySQL.
After the conversion, the files were ready to be loaded. Júlia considered using the Table Import Wizard, but ran into performance problems, so she chose a better method, the LOAD DATA LOCAL INFILE command, which completed the extraction of the database.

6 - Extra Information
With the data loaded on her computer, Júlia found some interesting facts about the scope of the data she was working with. Here are a few highlights of the dataset used in this project.
- Rows
- 158,366,934 rows of information
- Collection Period
- Data spanning 1894 to 2024
- Columns
- 32 distinct columns across the 5 tables
- Collection Region
- More than 240 different countries
- Size
- 12.73 GB of table files
For more information, click here
PART 2
Analyzing with MySQL and Power BI
This section of the project contains the main and most interesting queries developed throughout the project. Alongside them are comments that add context and curiosities and improve the overall storytelling, plus Power BI visualizations that make the results of the code clearer.
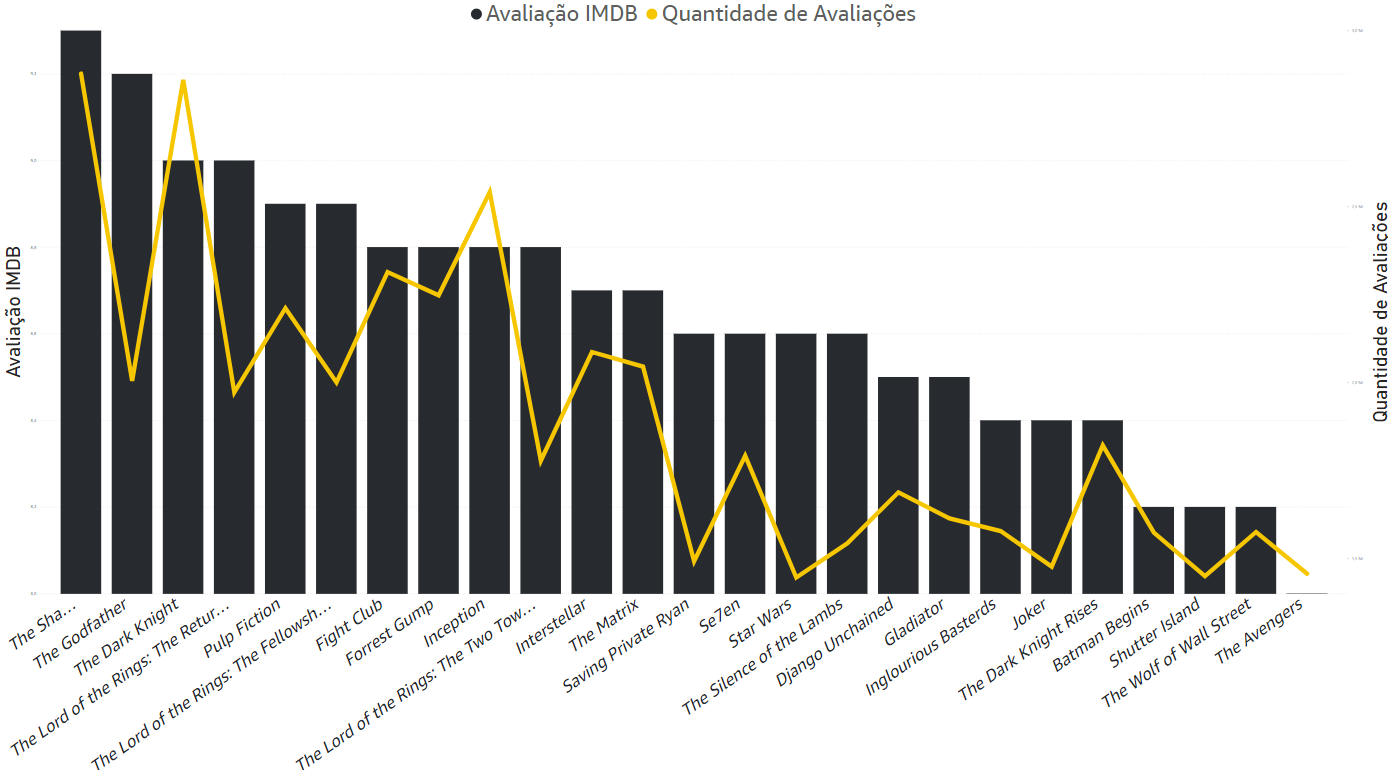
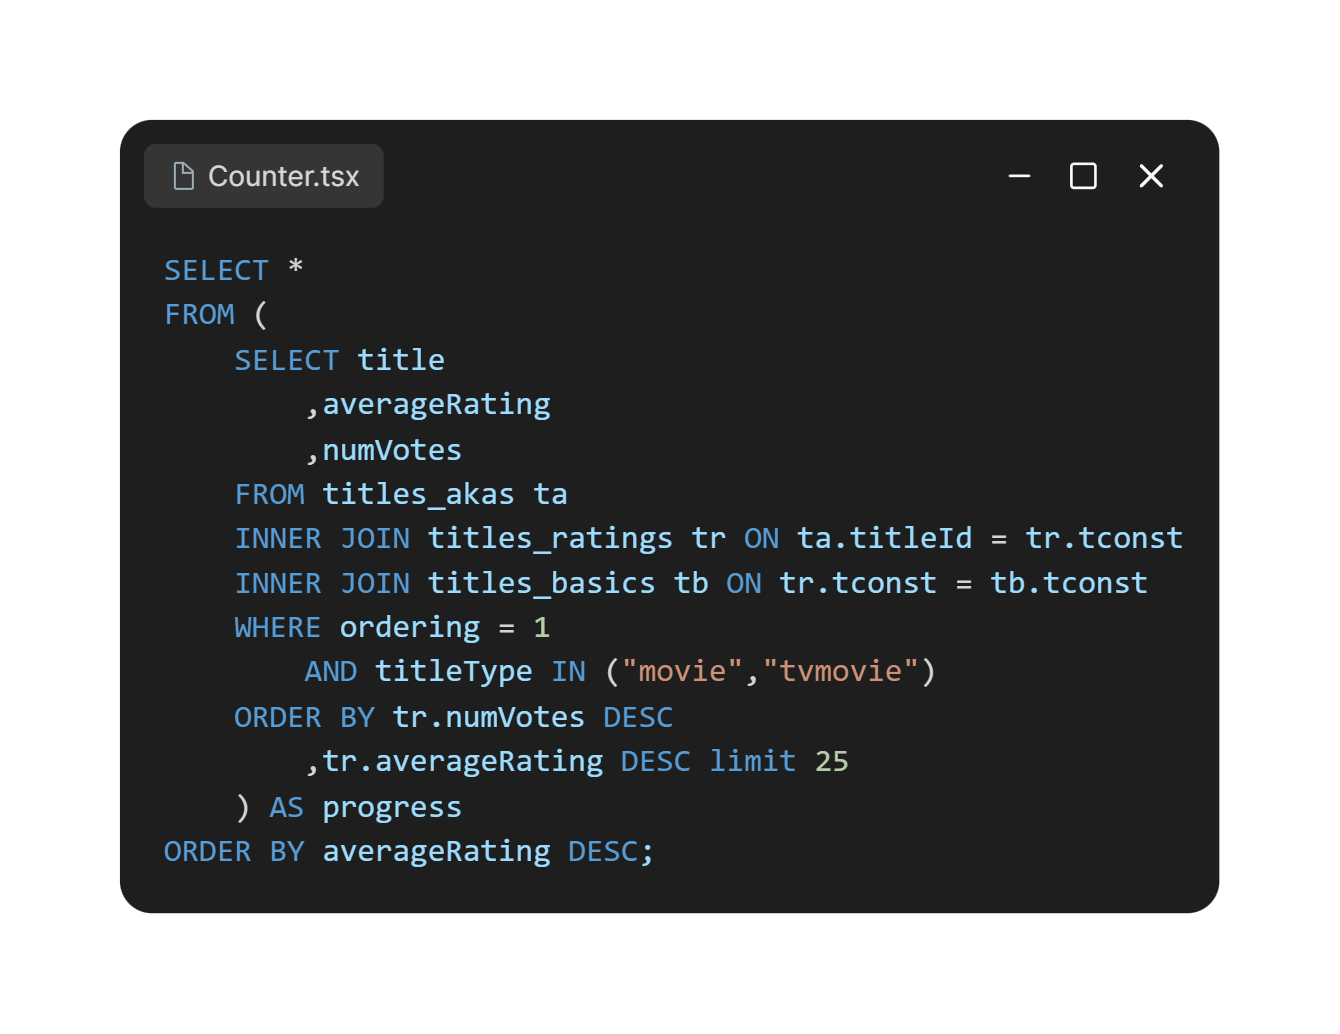
1 - The Top 25 Movies on IMDb
This query returns the 25 highest-rated movies on IMDb. One detail is that it filters by averageRating twice to make the result more relevant, while keeping the order mainly by numVotes in the subquery.
2 - Most Promising Genres for 2024+
This query counts the genres expected for movies, series and short films to be released from 2024 onward. It is a simple query that helps us understand future trends in this market.


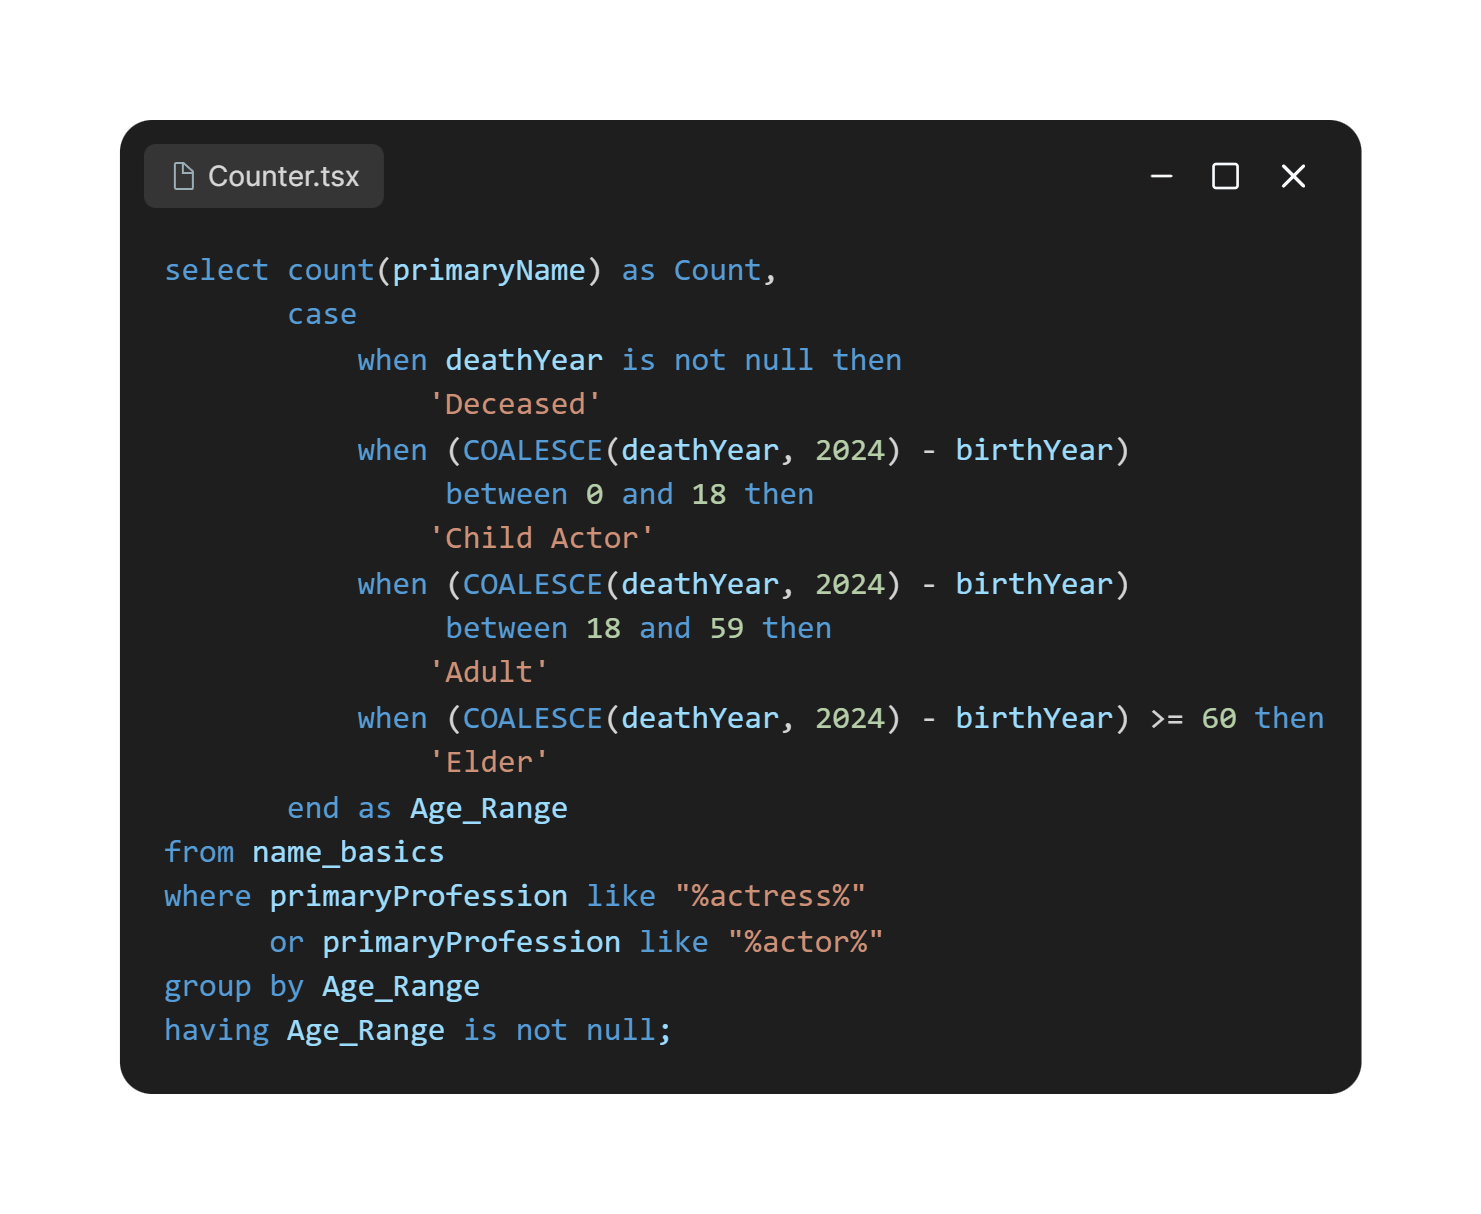
3 - Age Group Breakdown Among Actors
This query returns information about the age groups credited on IMDb. Since this dataset did not include the artists' ages, I used the COALESCE function to calculate them, because many deathYear values were null.
This was also the first query of this project.

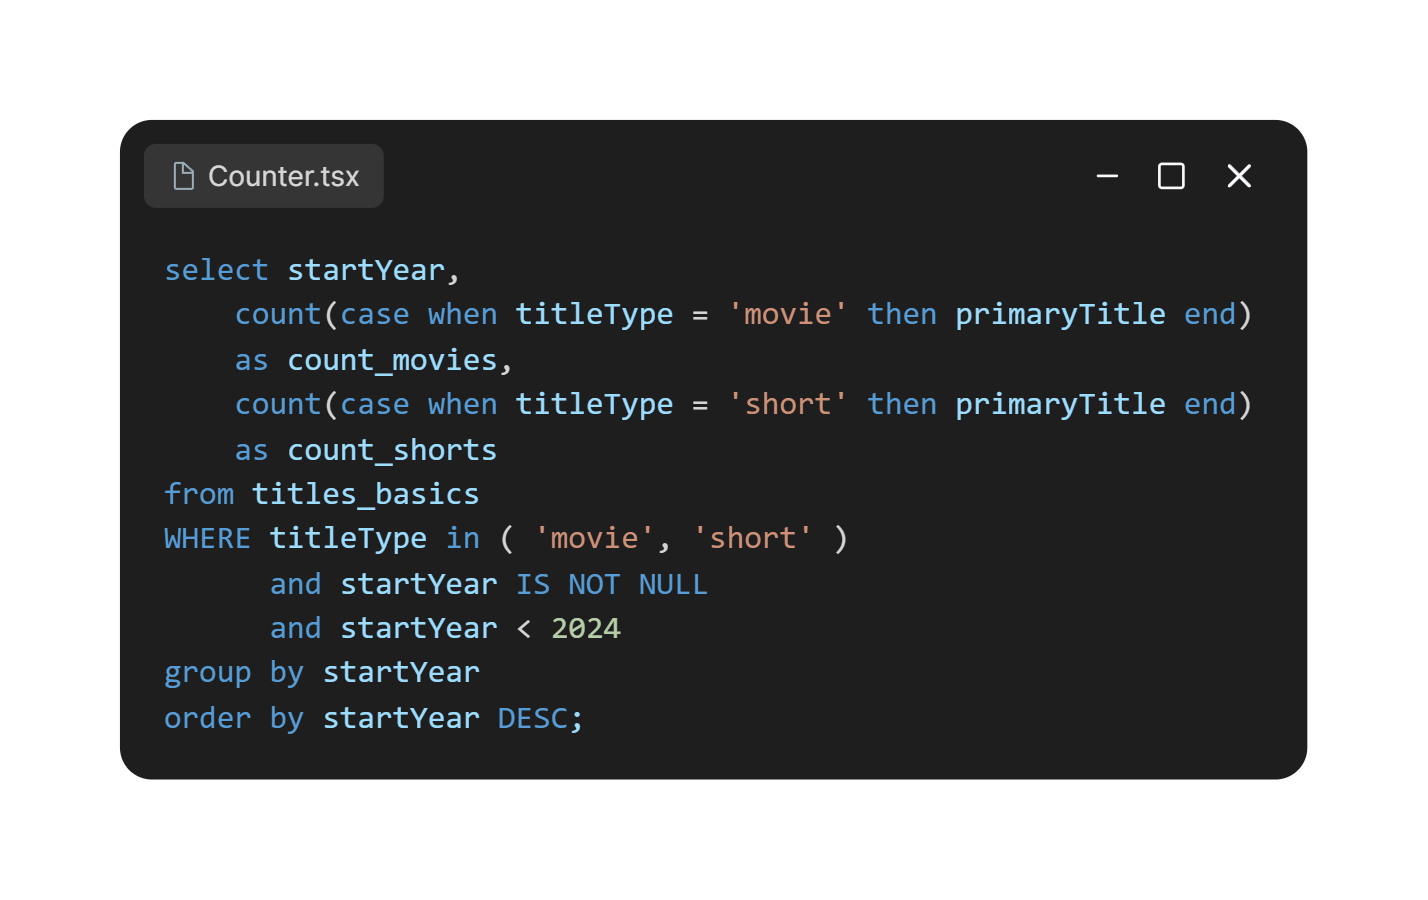
4 - Short vs. Feature Films Over the Years
This query compares the production of short films with that of feature films. Thanks to the breadth of this dataset, there is data from 1874 to the present day, a simply incredible span!

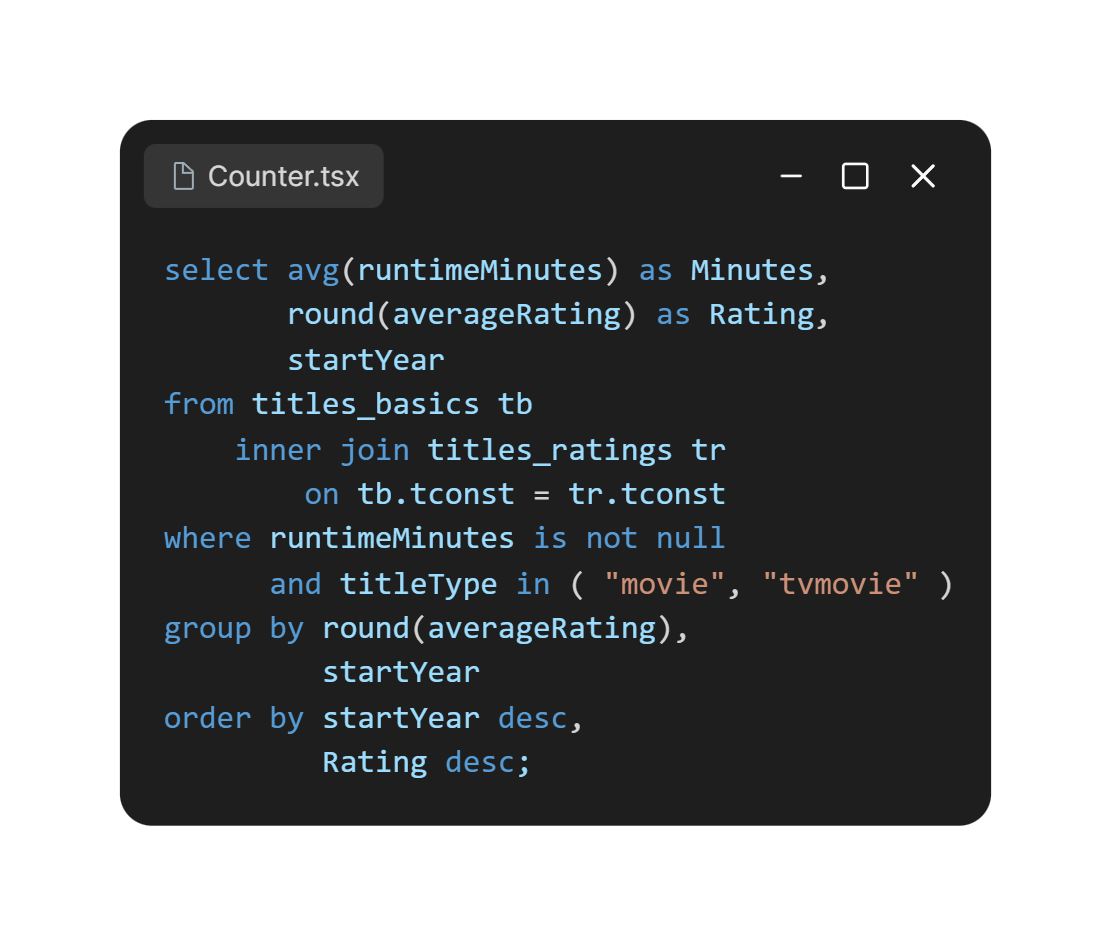
5 - Trends Over Time: Runtime vs. Ratings
A very interesting query that shows how time has affected movie runtimes. We found that in 2008 the average runtime of a "10-rated movie" was 78 minutes, while today, in 2024, it is 102 minutes and 24 seconds.
The visualization above was built in Power BI to make the comparison between runtime, rating and changes over time clearer.

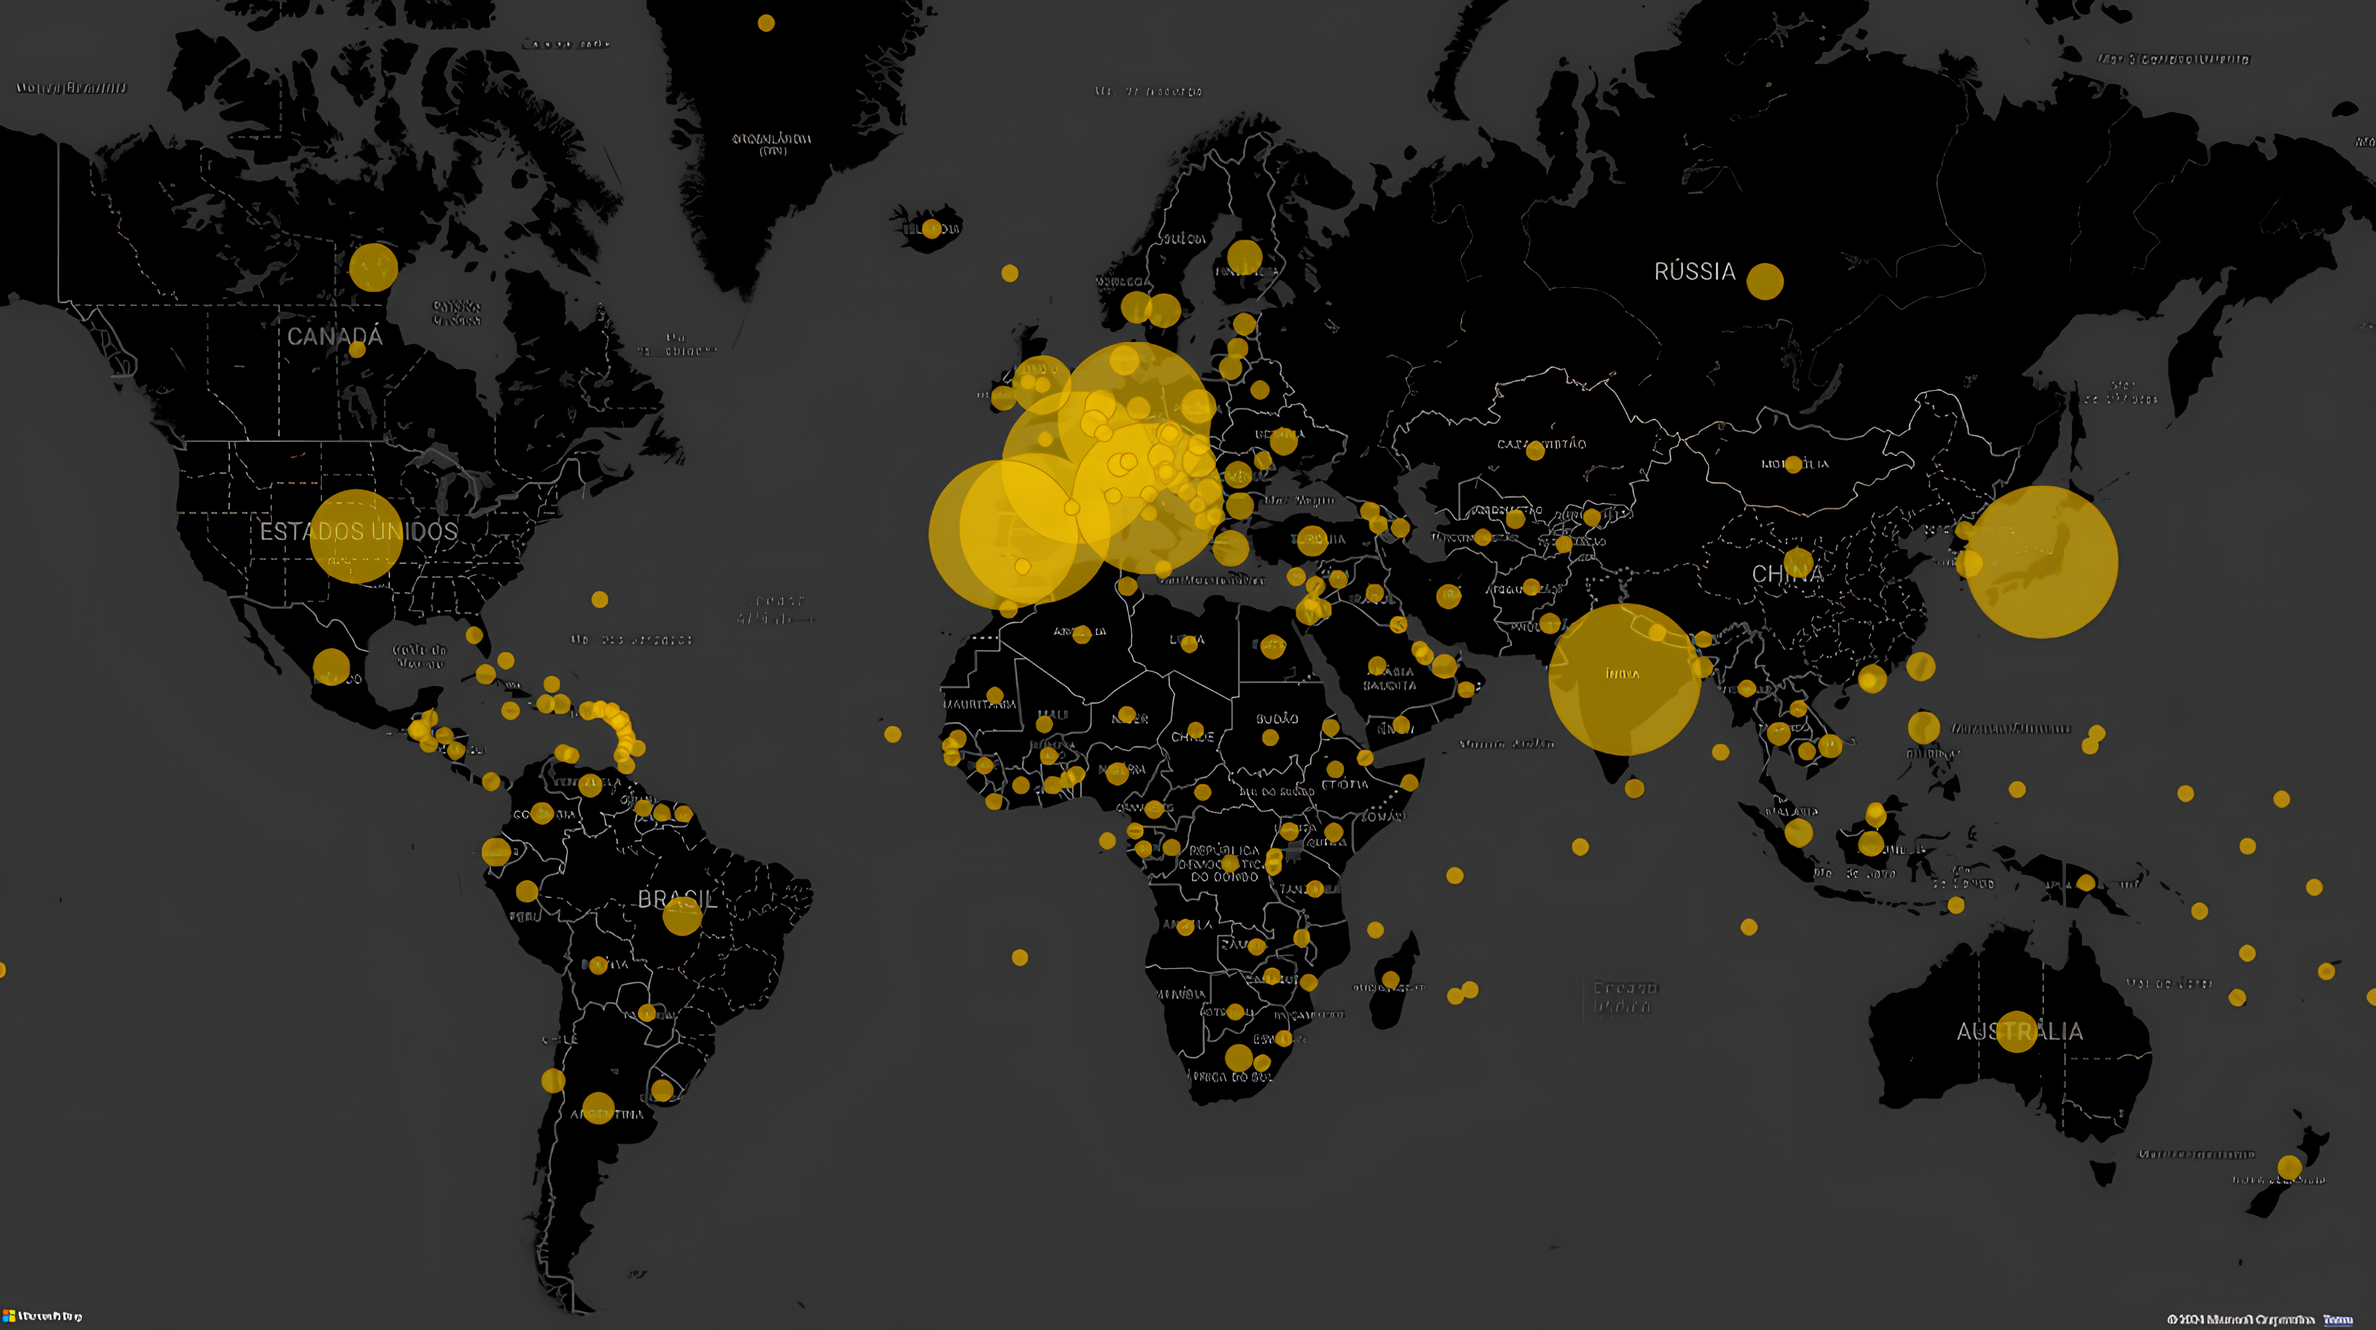
6 - Regions by Number of Adaptations
One of the simplest queries, counting the titles adapted for regions around the globe. Brazil is in the TOP 13, with 126,385 adapted titles.

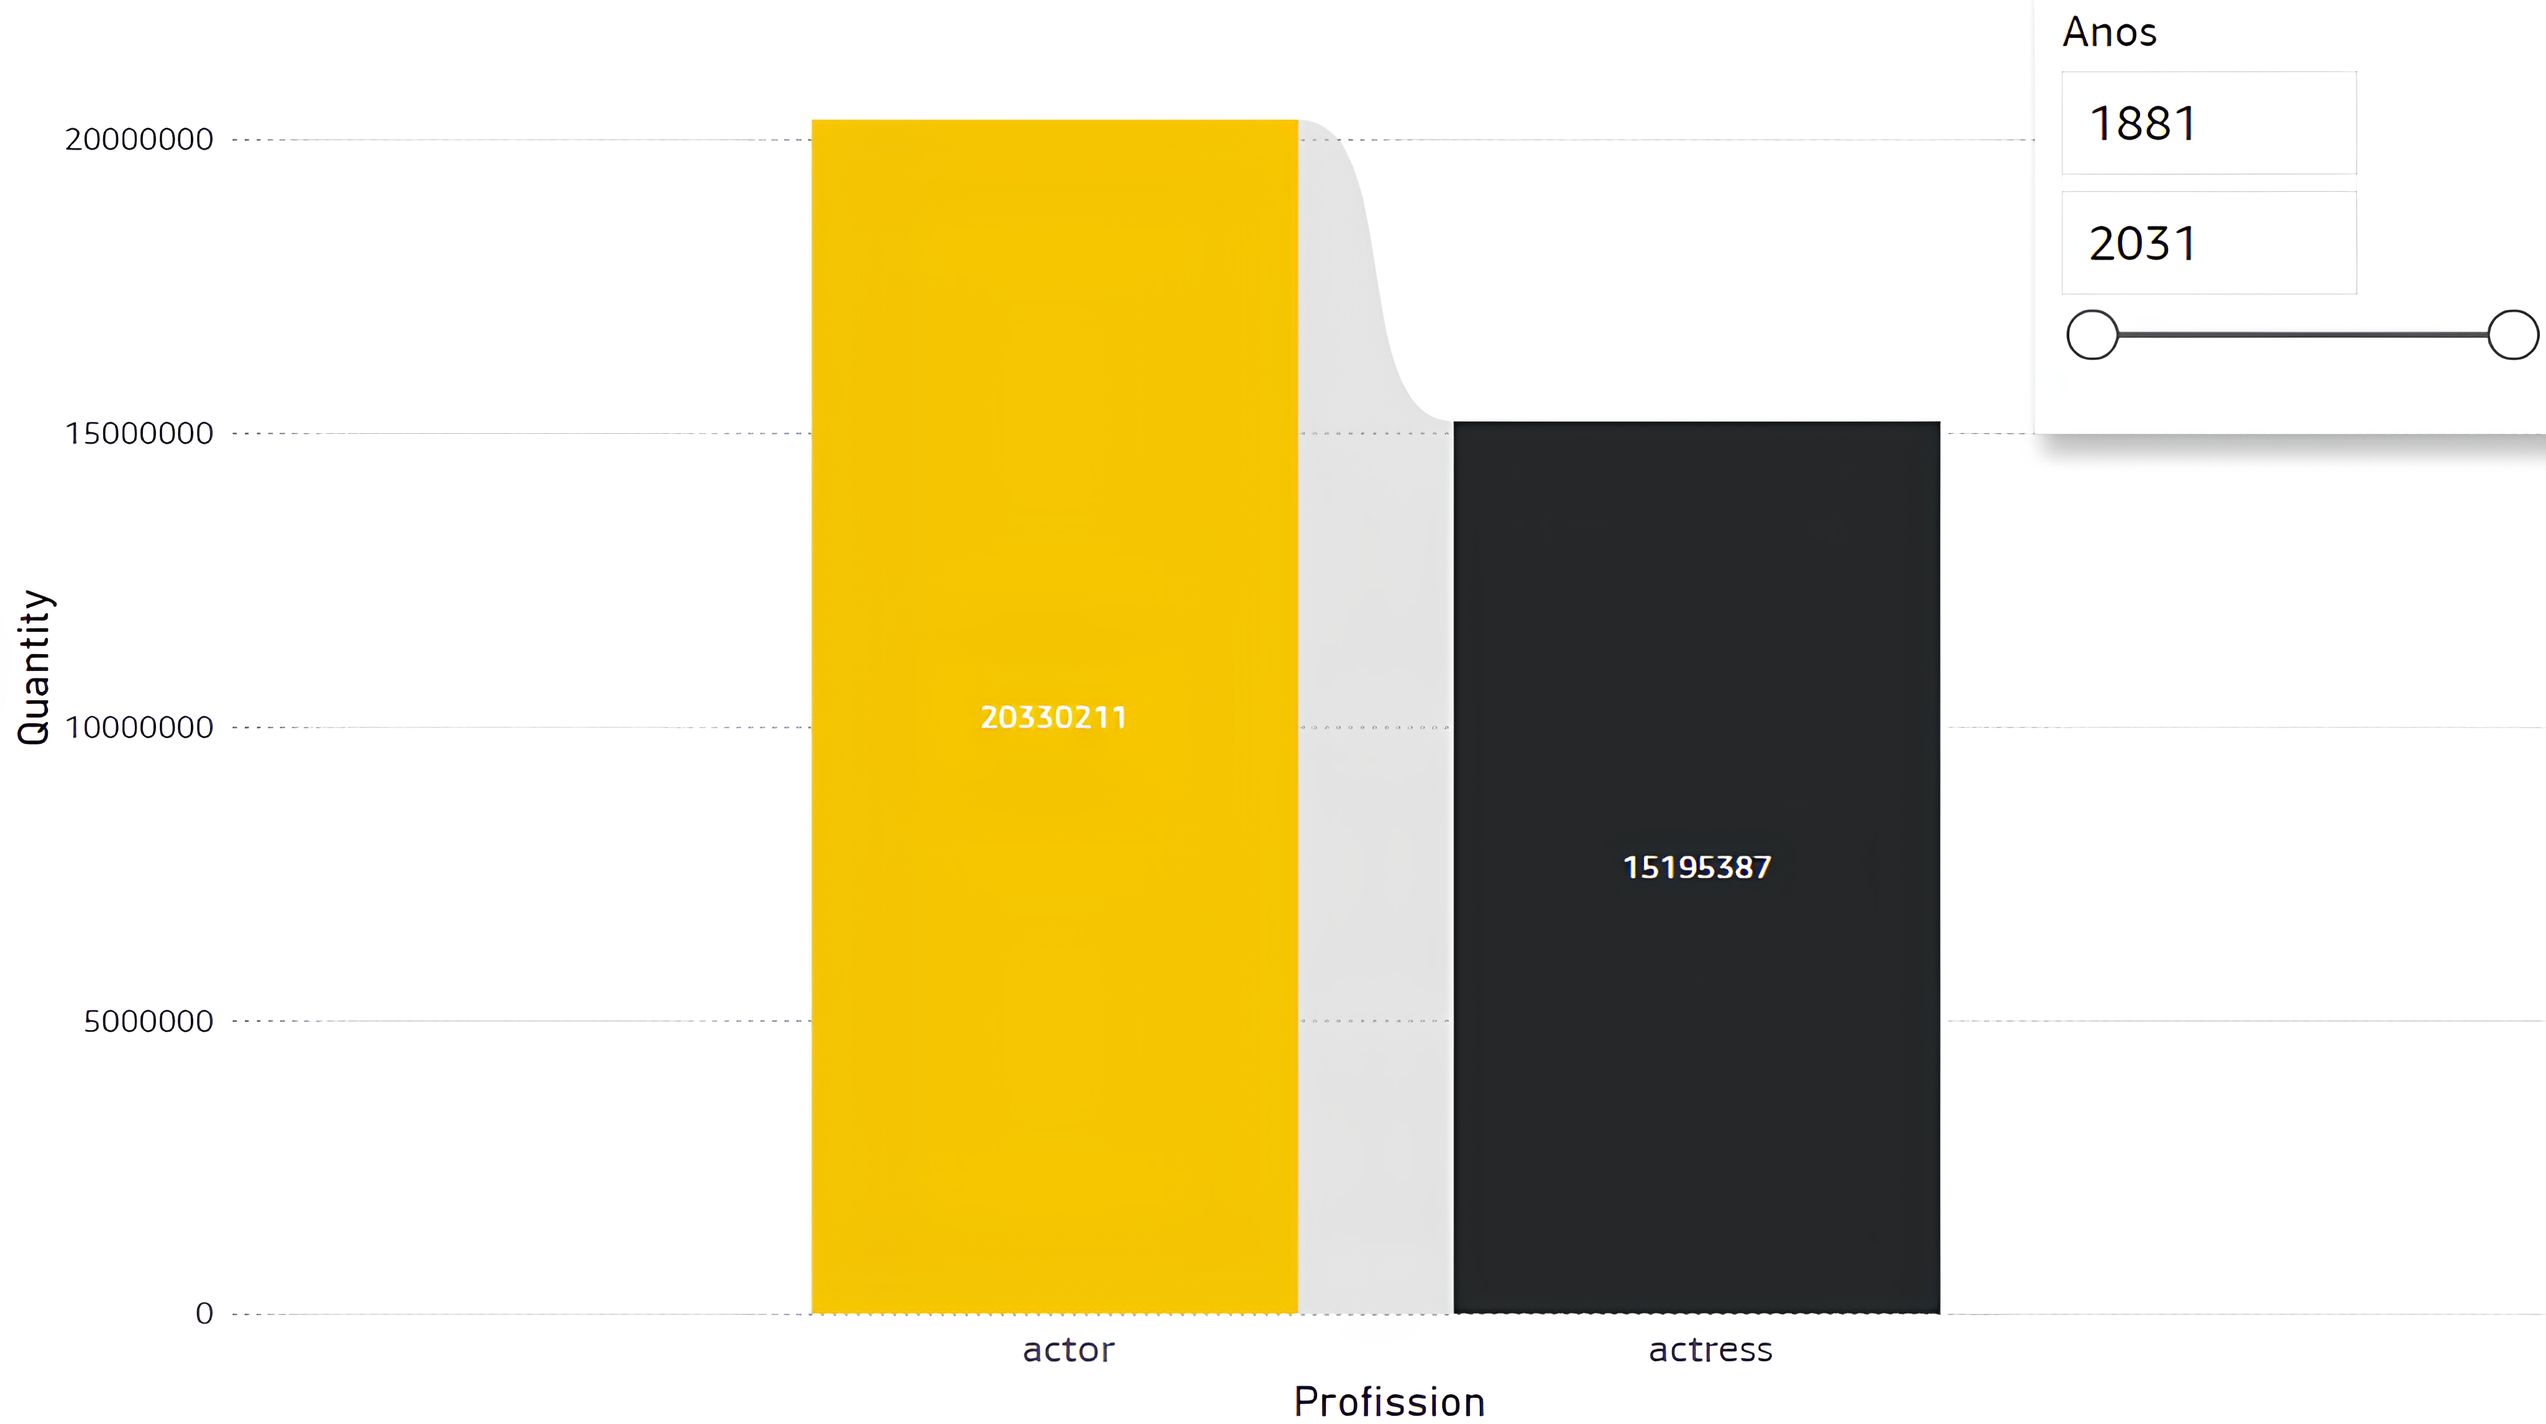
7 - Men vs. Women in Entertainment
This query brings up a very important discussion today: the gender gap in the job market. It is a pity this dataset does not include salaries, which would make the analysis even more interesting.

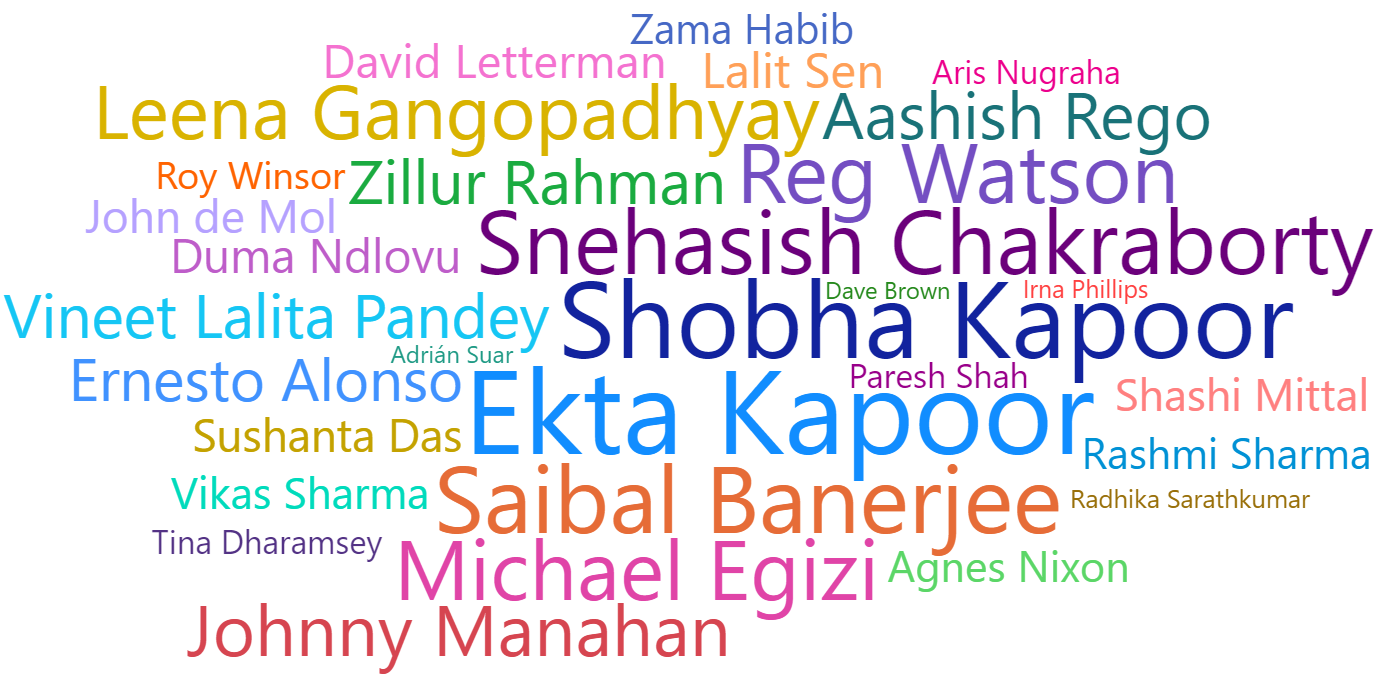
8 - The Industry's Most Prolific Professionals
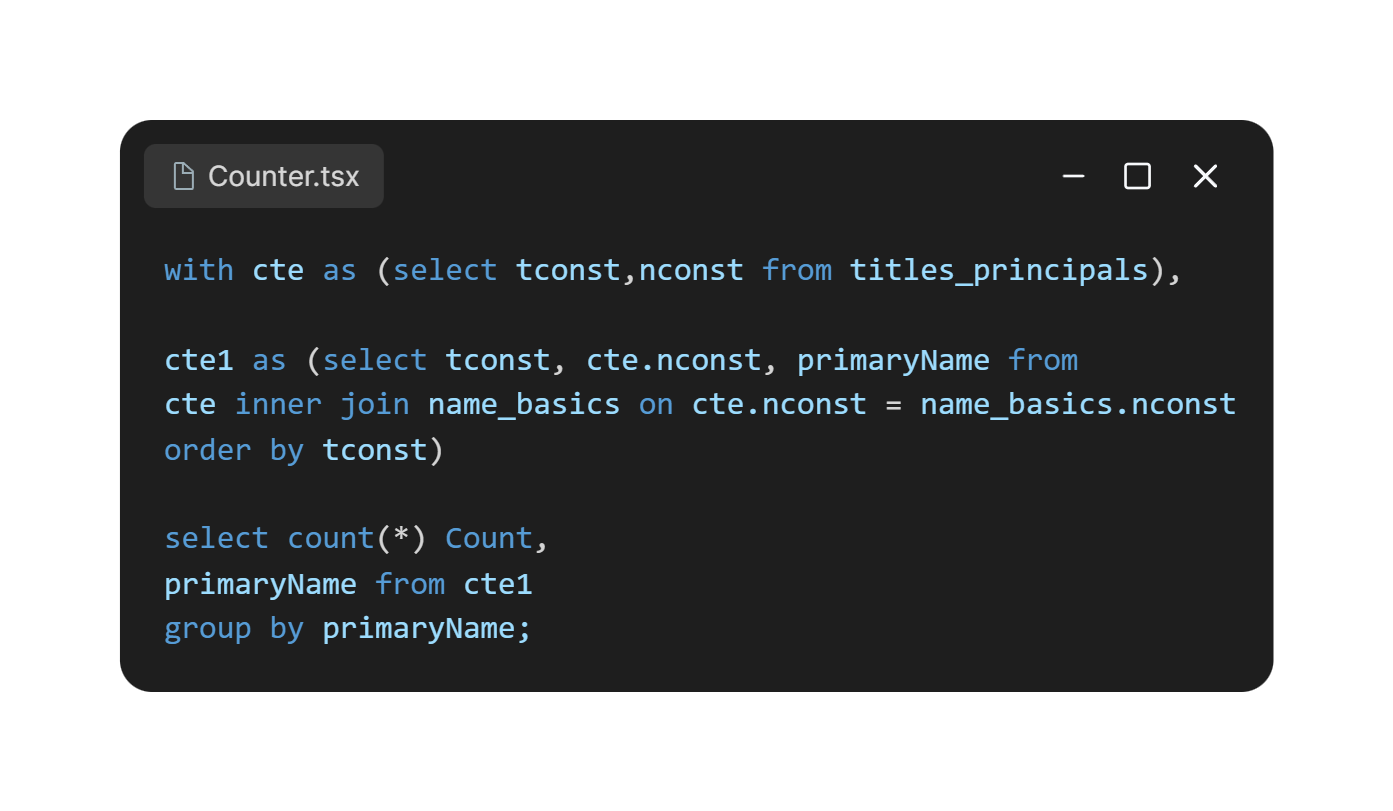
This query returns the most "credited" names on IMDb, that is, the people who most often appear in production credits. It is also one of the heaviest queries in terms of performance.
9 - Oldest Series Still Running
A query that is both interesting and useful: it returns the oldest series that are still receiving new episodes, and, impressively, The Simpsons is only in ninth place!


10 - Film Industry Profits by Year
This query returns the overall profit of the film industry over the years, from 1913 to 2024. A remarkable detail of this query is that it shows the impact of the COVID pandemic on this sector between 2019 and 2021, with a dramatic drop in overall profits during that period.


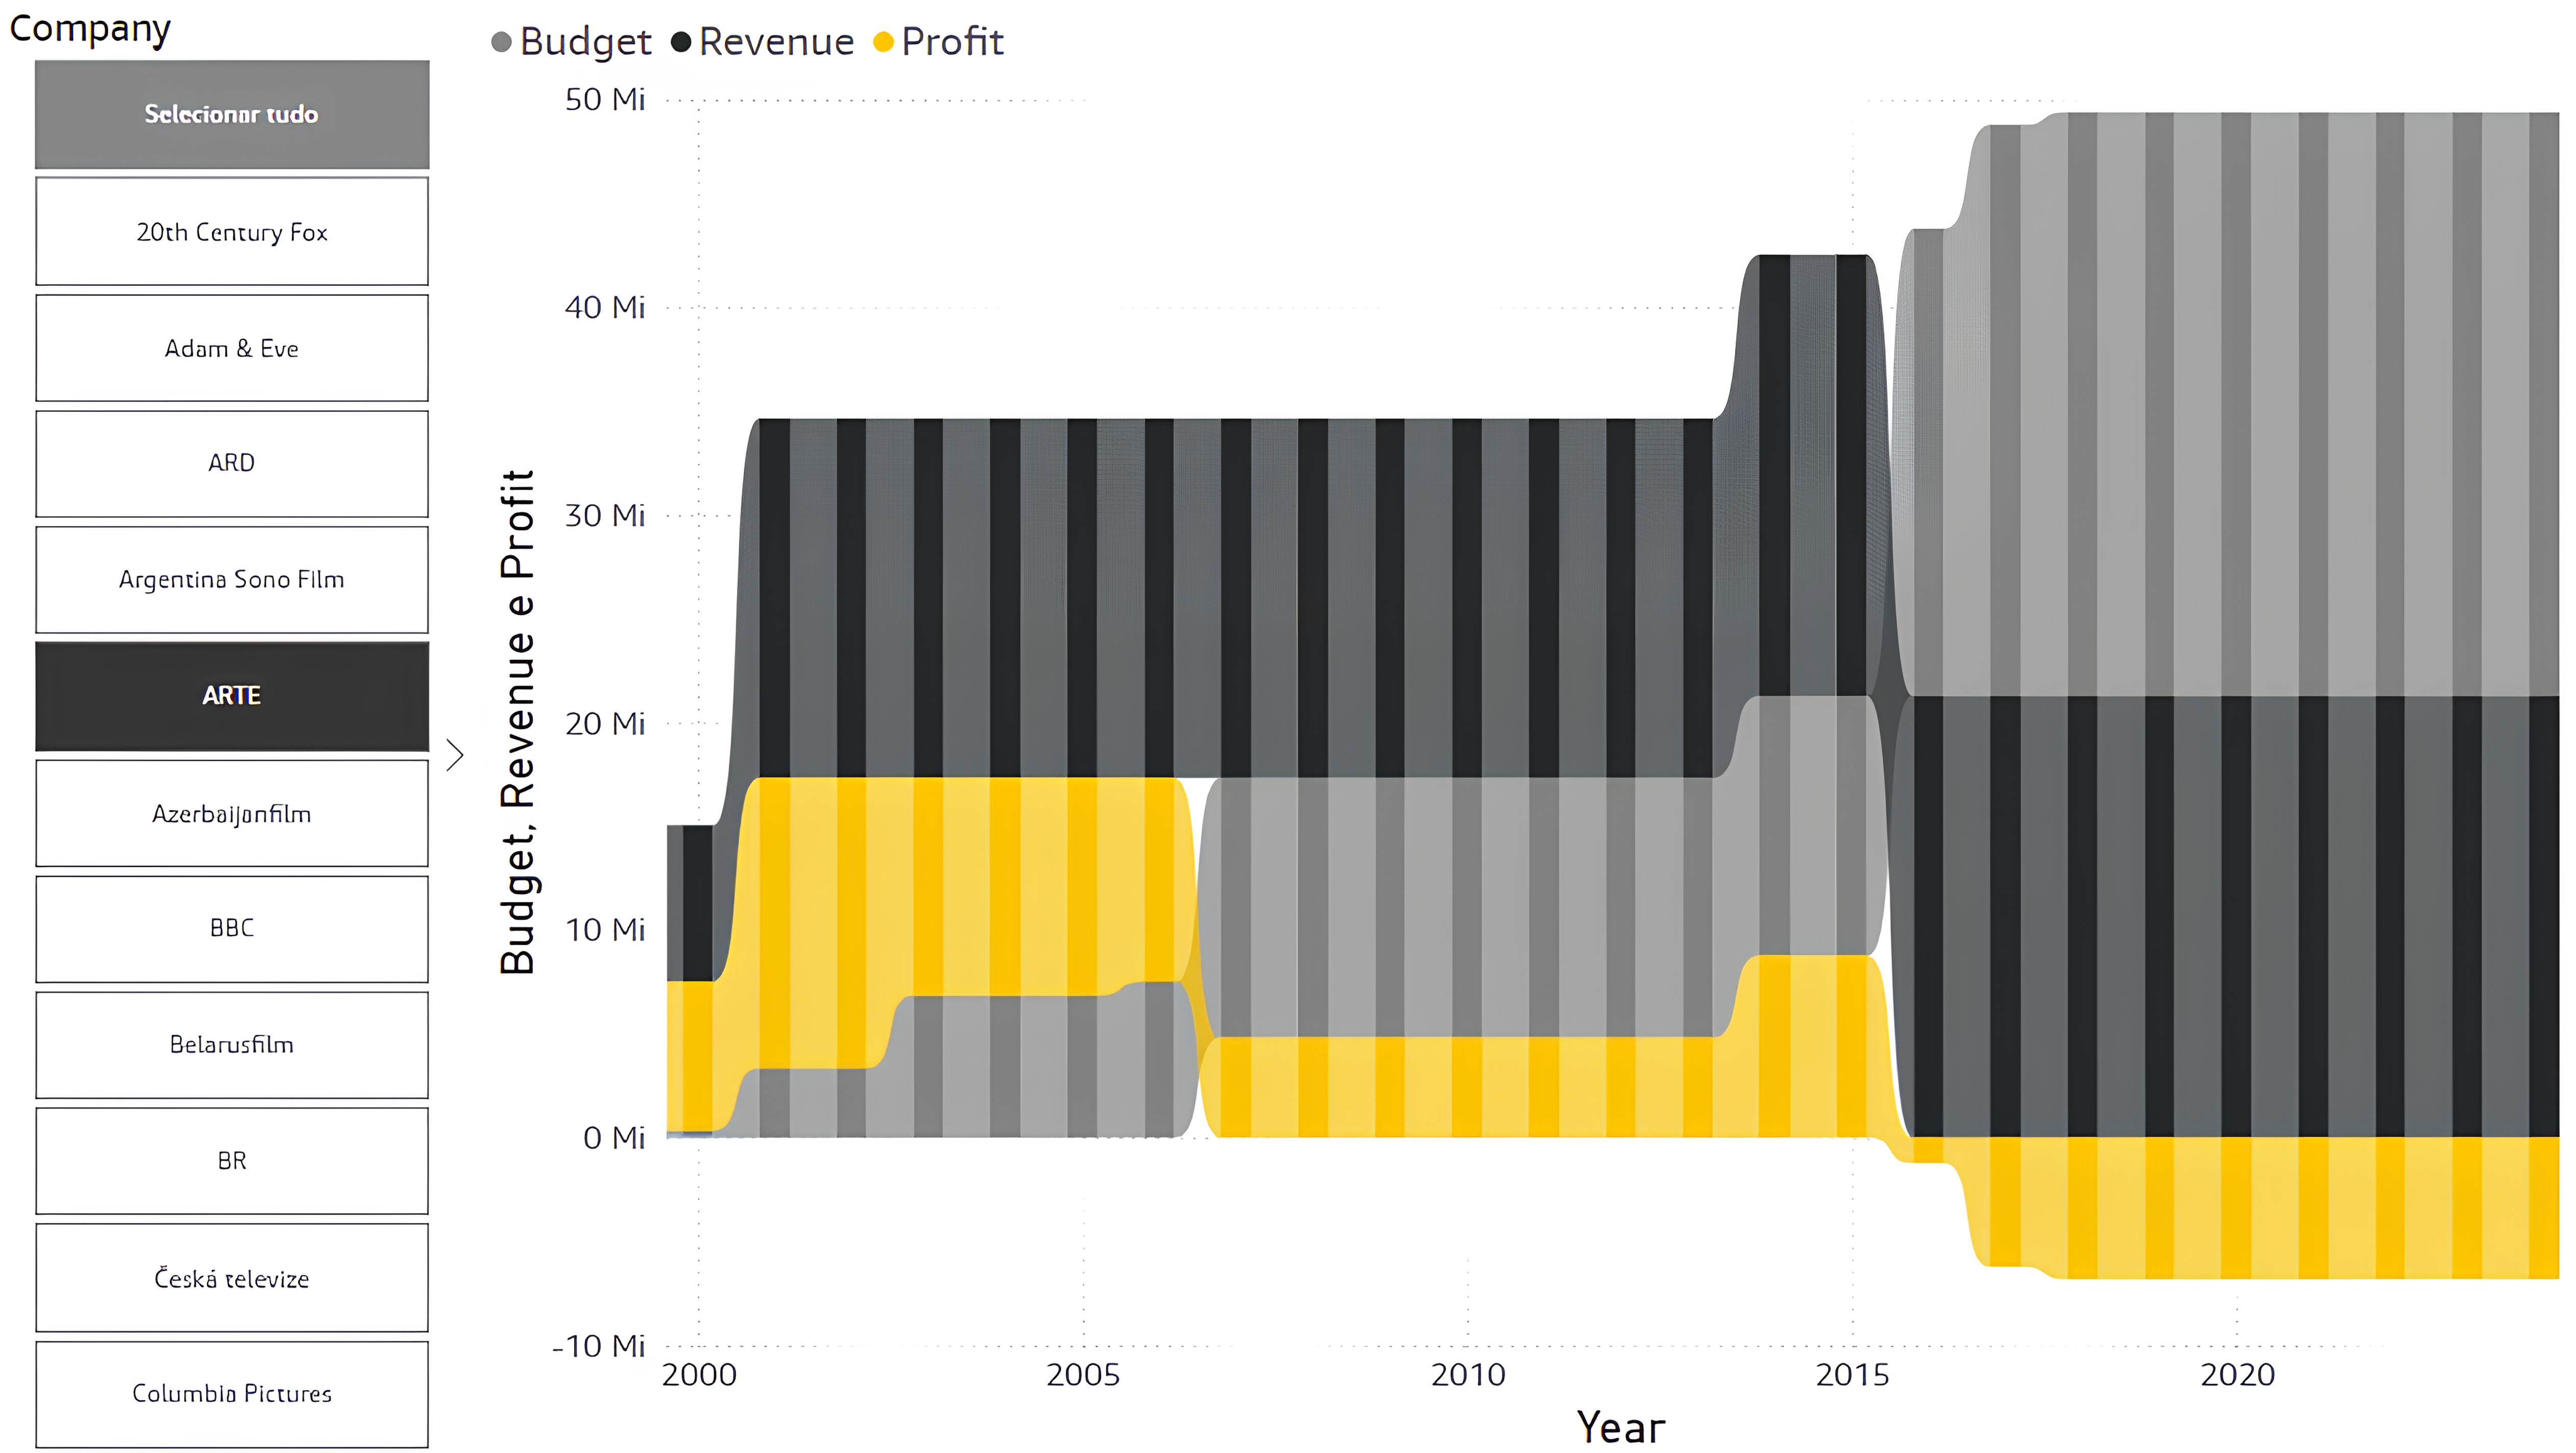
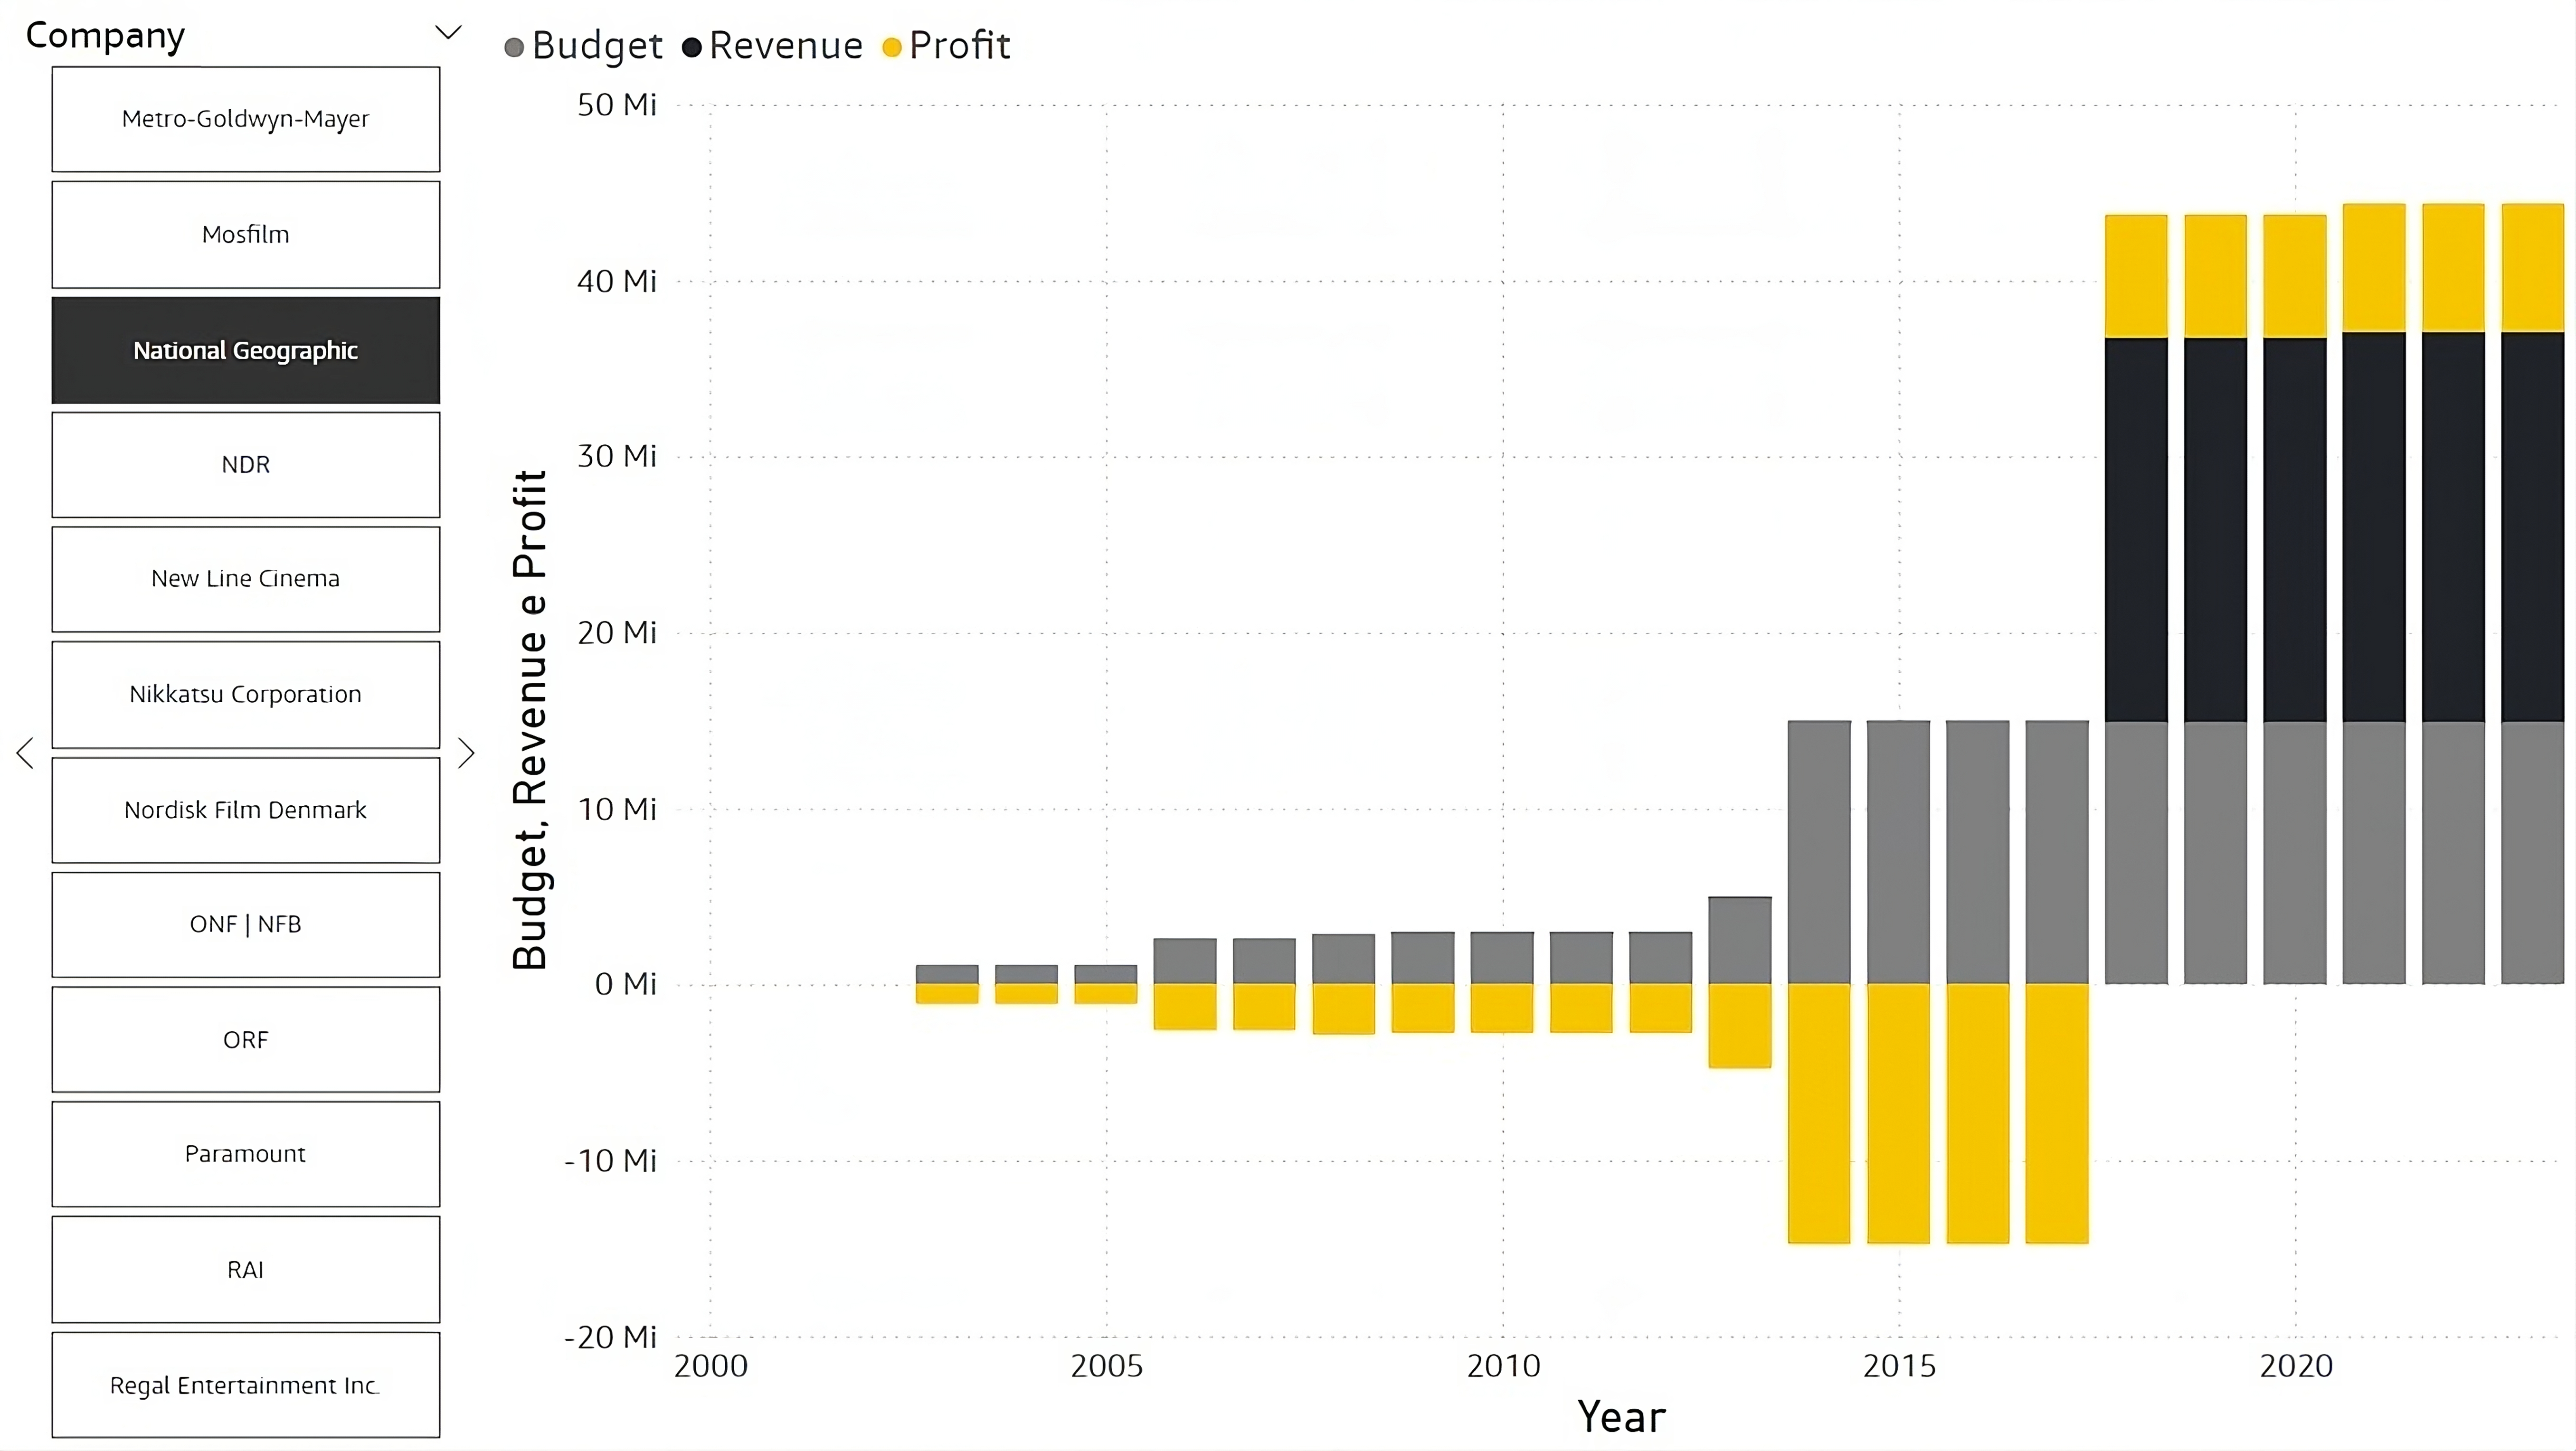
11 - Gross Earnings by Company Over the Years
This query presents, by year, the cumulative sum of both the earnings and the costs of companies, based on a filter on those same sums. The Substring_Index function is used to select only the first (main) company among the set of companies involved in each production.
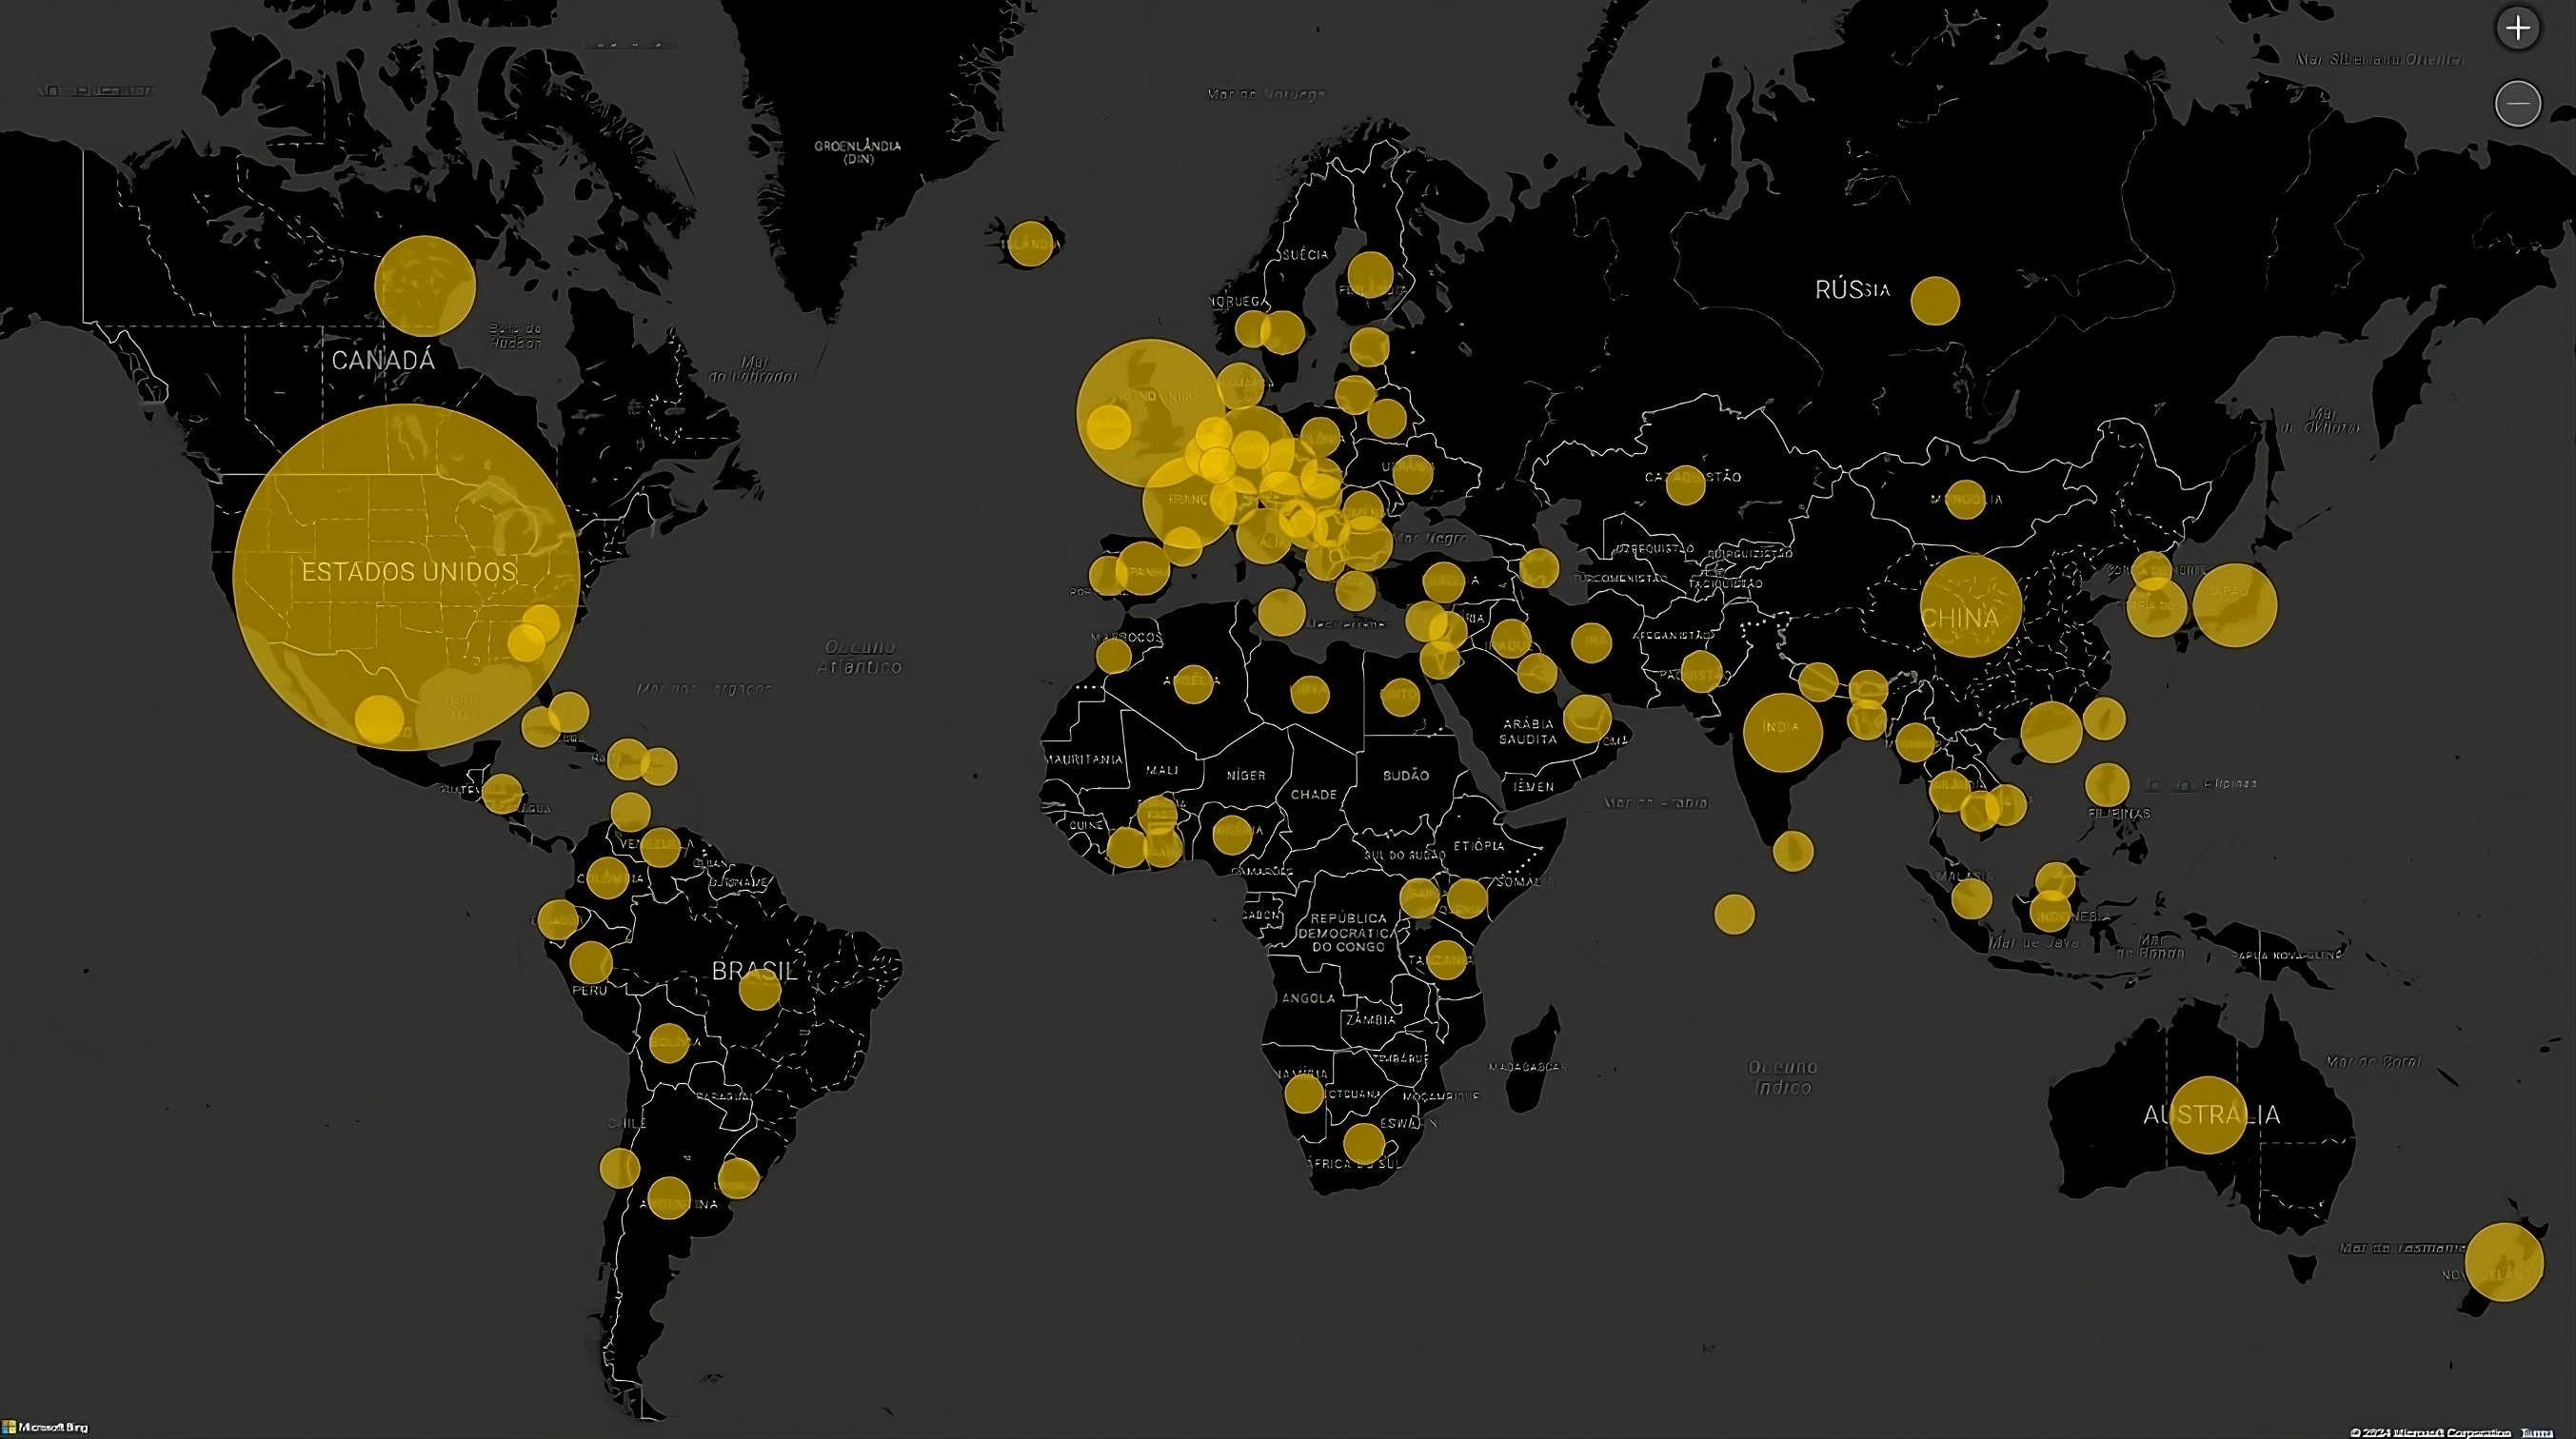
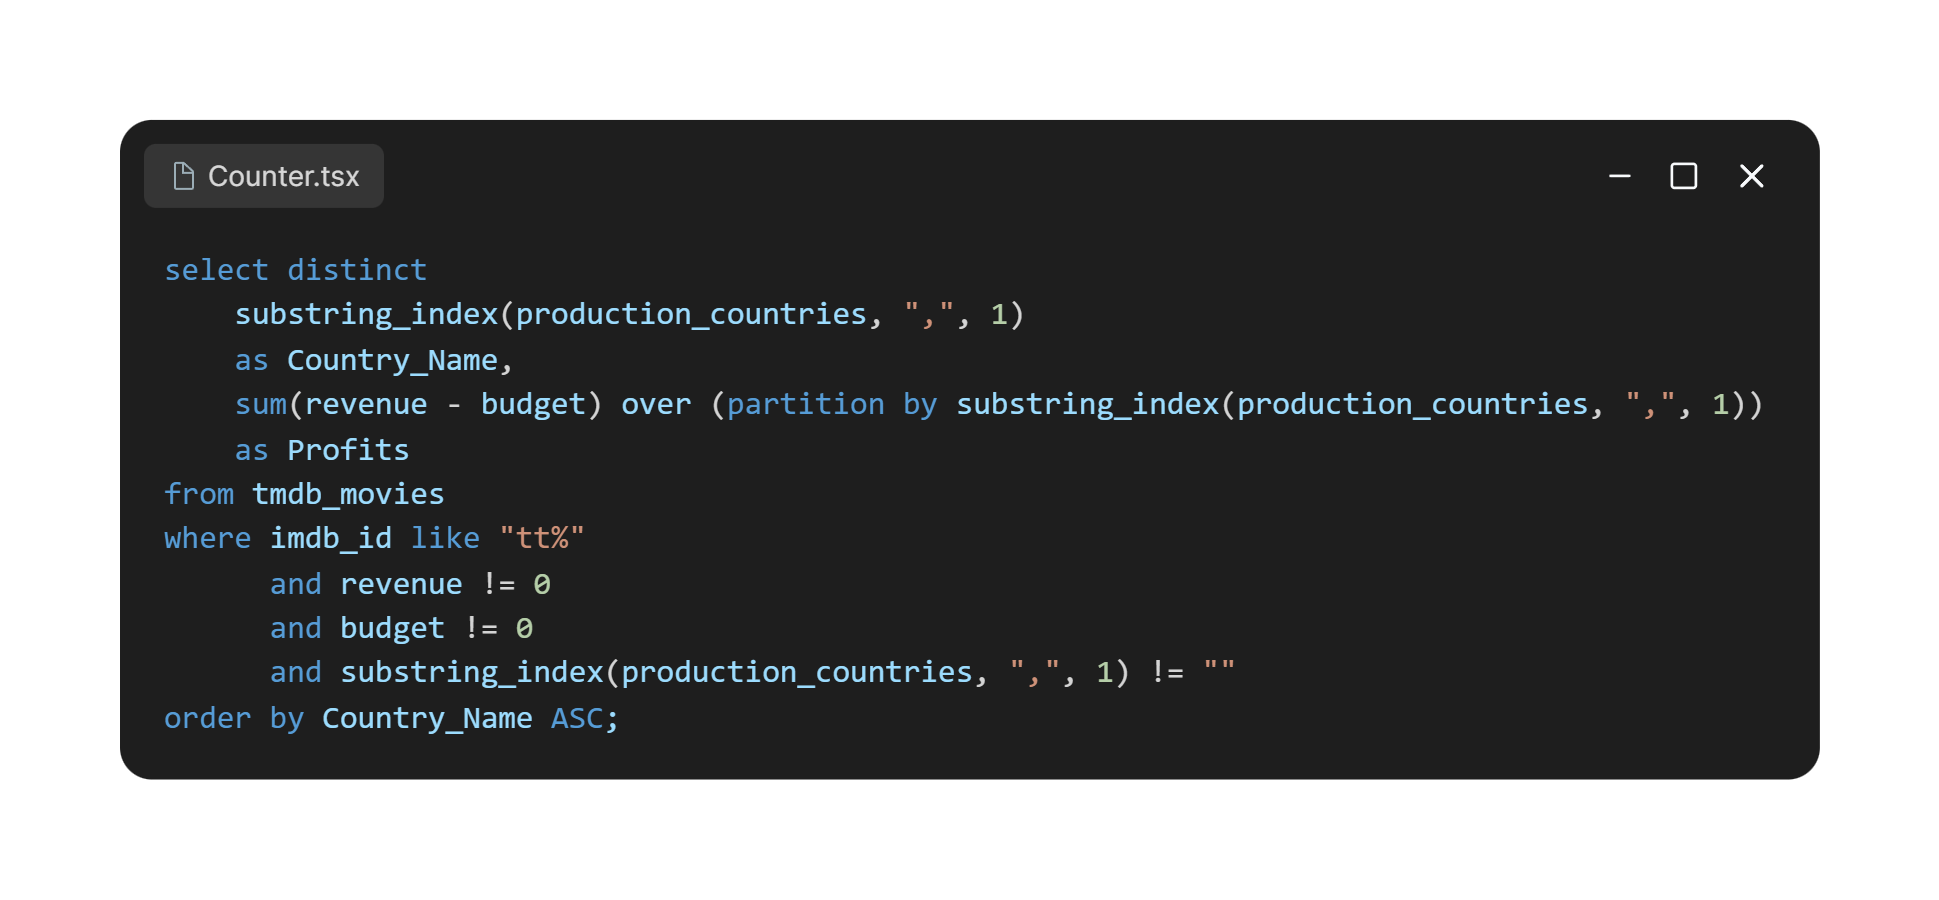
12 - Industry Profits by World Region
This query works from a single table. The SUM function is used with the OVER clause to calculate the cumulative sum of profits for each country.
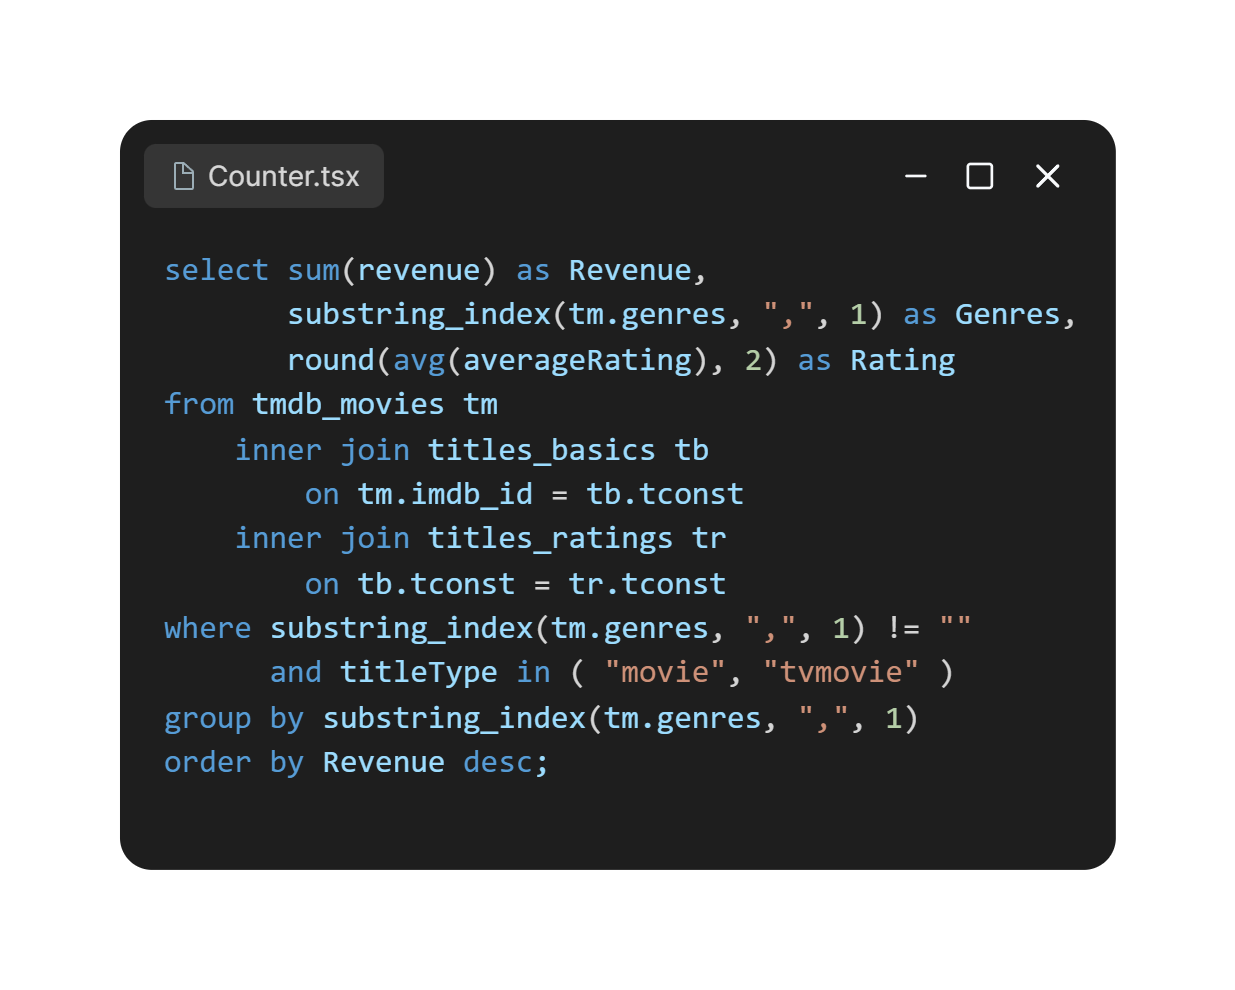
13 - Profits by Movie Genre
This query shows the relationship between production profits and the ratings received. Interestingly, they do not always go hand in hand: "Documentaries", for example, have the best ratings and also some of the worst profits.

PART 3
Final Report
The final section of this project brings together the main points observed in the insights from Part 2, organized by theme to make the conclusions easier to read.
1 - Insights Report
Profile of the Industry's Members
- Most living actors and actresses are adults, a good share are seniors, and child actors make up a very small part of the total.
- The gap between men and women in acting is still large, but it is smaller than in the past, when it reached 2:1, as in 1940.
- Some of the best-known names in this industry are Reg Watson and Ernesto Alonso, with a highlight for the Kapoor family: Ekta and Shobha are in the TOP 3, both Indian women producers of television, film and web series.
Industry Economics
- Overall, the industry showed steady growth in profits. With the COVID-19 pandemic, however, the sector suffered a sharp drop and has not yet recovered: in 2020, the industry's profits were similar to those of the mid-1980s.
- Most of the regions earning the most in this industry are in the Northern Hemisphere, especially the United States, whose profits exceed those of several continents.
- The most profitable genres in this industry are Action, Comedy and Adventure, but they also have low ratings. Other options, such as Documentary, History and Mystery, have low profits but higher ratings. Genres such as Animation and Drama would be good middle-ground options.
Forecasts for 2024+
- The genres we expect to see most from 2024 onward are Drama, Comedy, Documentary and Action. The genres we will see least are Talk Shows, Game Shows and News.
- Until the early 2000s, larger productions were more common. With the rise of the internet, and with cameras and other equipment becoming more affordable, producing content became easier, so from that point on, smaller productions have become increasingly common and now dominate in volume.
- Ratings change depending on a movie's runtime. In 2001, the standard was movies of about 90 minutes, yet 58-minute movies had a higher average rating overall. Today, in 2022–2023, the standard has risen to 96 minutes, but movies of about 88 minutes get better ratings.
Miscellaneous
- Most adaptations go to Europe, India and Japan. The low number for the United States stands out, which makes sense, since it is the largest producer of the content that gets adapted. Brazil, though less prominent, is 13th on the list.
- Among the highest-rated movies on IMDb, three stand out: "The Shawshank Redemption", "The Godfather" and "The Dark Knight". The last one, despite having the same rating as "The Lord of the Rings", has many more votes, which indicates a higher degree of certainty.
2 - Conclusion
This concludes this data analysis project, in which the data was extracted, analyzed and visualized. The simulated scenario with the character Júlia and the company MoviesNow was useful for giving my work a business context. A lot of learning went into this project, and even more came out of it. Thank you for your attention!
View repository on GitHub